Difference between revisions of "KPI's and AWStat data"
m (→Conclusions) |
|||
| Line 110: | Line 110: | ||
===Conclusions=== | ===Conclusions=== | ||
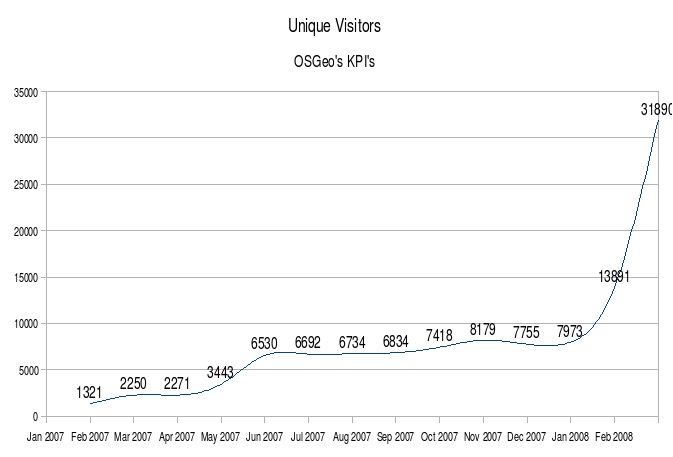
| − | + | In february we can observe a significant growth in unique visitors to OSGeo from 13,891 in January to 31,890 this month of 2008. That means that the audience has more than doubled in 1 month. A successful result. | |
| + | |||
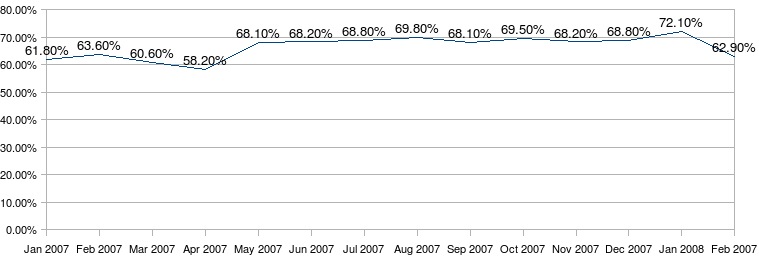
| + | But as not all are Flowers in the beginning of Spring (Note I'm based in the north Hemisphere right now), most (62.9%) of our visitors stay in the website for less than 30 seconds before they leave. What can this mean? Do we not have what they want, or simply are we not communicating to them exactly what we have (In less than 30 seconds). | ||
| + | |||
| + | It is known that GIS is quite difficult for the normal human being to understand and it is true that there are a lot of difficult words being used out there... not that this is bad. But maybe all of those people are flying away because they really can't figure out what all this is about anyway... well maybe I am very wrong here but the aims are (As I understand them to be anyway): | ||
| + | |||
| + | # To Gain more sponsors | ||
| + | # To get more contributers/volunteers | ||
| + | # To make people know about OSGeo | ||
| + | |||
| + | So, taking these things into account it is a good Idea to discuss the numbers shown in this report and focuss marketing actions. | ||
| + | |||
| + | Another comment that maybe important is to note that the third most viewed link (http://www.osgeo.org/download) is Broken, and that is very serious as it may create a kind of unreliability within the users of the website. | ||
Revision as of 01:40, 19 March 2008
Key Performance Indicators (KPI) are metrics used to quantify strategic performance of an organization, company or even a website. They can reflect and indicate areas of success or failure within it.
To define an organization's KPI's, an interesting way is to link them to the acronym SMART, therefore good KPI's are usually:
- Specific
- Measurable
- Achievable
- Result-oriented or Relevant
- Time-bound
OSGeo's Preliminary KPI's
In order to obtain OSGeos' KPIs the chosen source of information is AWSTATS, a web analytics FOSS that provides pretty interesting data. On these slides, it may be easier to understand.
So, for starters the KPI's that show OSGEO's performance are:
- Unique Visitors
- Visits (duration)
- Pages (most viewed)
- Most searched for Keywords
Unique Visitors
A unique visitor is a metric that describes a unit of traffic to a Web site. It counts a visitor only once in the time frame of the report. This statistic is relevant for the marketing committee as a measure of a site's true audience size**.
The data for February 2008 Shows that from that month there has been considerable growth in audience. What is the reason for this? Please input your ideas in the box below the chart.
* Idea 1
* Idea 2
** True Audience Size: Note that the data from the first months of 2007 are not 100% yet
Visits (duration)
This metric shows the length of time users are in the website. The chart below shows the users who stay in the website for less than 30 seconds.
- What can be done for users to stay longer? Please input your ideas in the box below the chart.
* Idea 1
* Idea 2
Pages (most viewed) - In January 2008
This is not as measurable as the KPI's mentioned earlier but it is an important information to have as it shows what are the users more interested in the website, or what they can use. This is a place in which we can discuss on weather to improve to get closer to the objectives of promoting OSGeo.
| Page | Number Of Views | Comments |
| http://www.osgeo.org/ | 55,214 | Works |
| http://www.osgeo.org/taxonomy/term/1/0/feed | 20,559 | Rss Feed, Works |
| http://www.osgeo.org/download | 6,013 | Broken Link |
Most searched for Keywords
| Keyword | # of Searches | % of total Searches |
| mapguide | 3557 | 12.5% |
| osgeo | 1444 | 5% |
| mapguide open source | 1061 | 3.7% |
Conclusions
In february we can observe a significant growth in unique visitors to OSGeo from 13,891 in January to 31,890 this month of 2008. That means that the audience has more than doubled in 1 month. A successful result.
But as not all are Flowers in the beginning of Spring (Note I'm based in the north Hemisphere right now), most (62.9%) of our visitors stay in the website for less than 30 seconds before they leave. What can this mean? Do we not have what they want, or simply are we not communicating to them exactly what we have (In less than 30 seconds).
It is known that GIS is quite difficult for the normal human being to understand and it is true that there are a lot of difficult words being used out there... not that this is bad. But maybe all of those people are flying away because they really can't figure out what all this is about anyway... well maybe I am very wrong here but the aims are (As I understand them to be anyway):
- To Gain more sponsors
- To get more contributers/volunteers
- To make people know about OSGeo
So, taking these things into account it is a good Idea to discuss the numbers shown in this report and focuss marketing actions.
Another comment that maybe important is to note that the third most viewed link (http://www.osgeo.org/download) is Broken, and that is very serious as it may create a kind of unreliability within the users of the website.

