Uploads by Codrina
Jump to navigation
Jump to search
This special page shows all uploaded files.
| Date | Name | Thumbnail | Size | Description | Versions |
|---|---|---|---|---|---|
| 04:18, 9 July 2013 | Codrina.jpg (file) |  |
137 KB | 1 | |
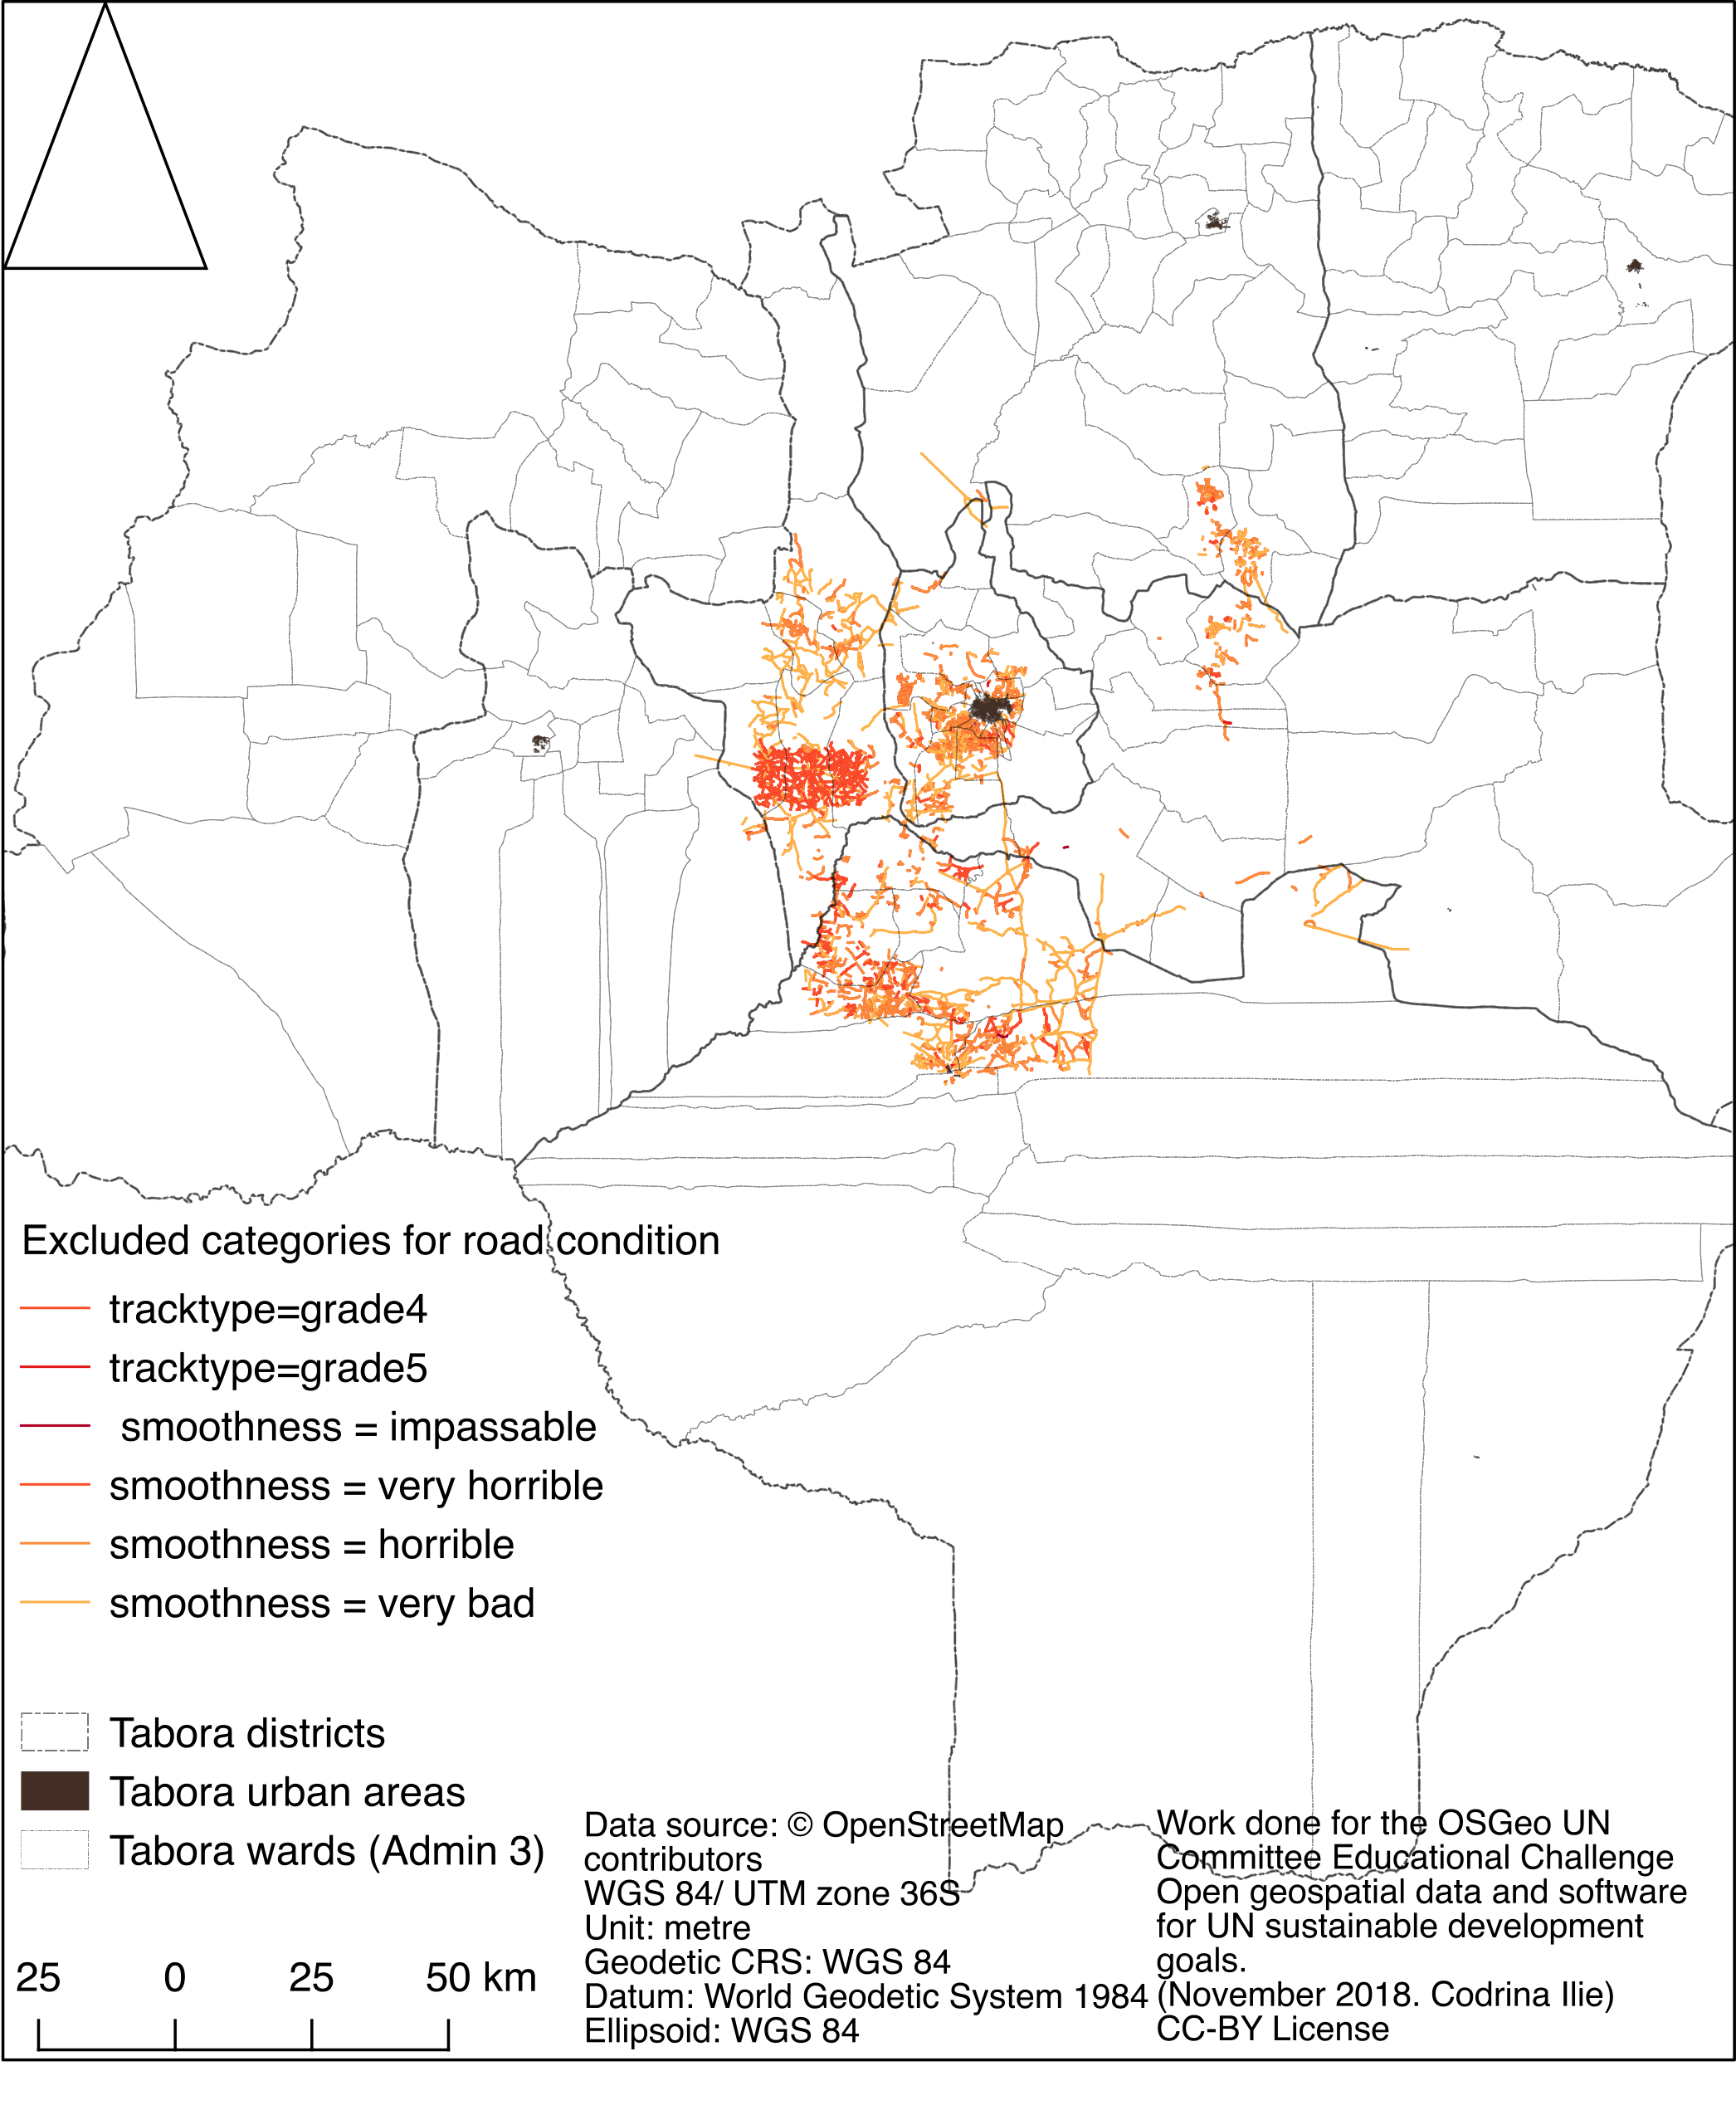
| 02:51, 21 January 2019 | Fig10 excludedRoads.png (file) |  |
1.1 MB | Spatial distribution of OSM roads that have been tagged as in bad condition. | 1 |
| 02:55, 21 January 2019 | Fig11 OSMRoads RAI.png (file) |  |
75 KB | Result of GroupStats on the OSM road network that has been tagged in good condition. | 1 |
| 02:58, 21 January 2019 | Fig12 length2000 initial Stats.png (file) |  |
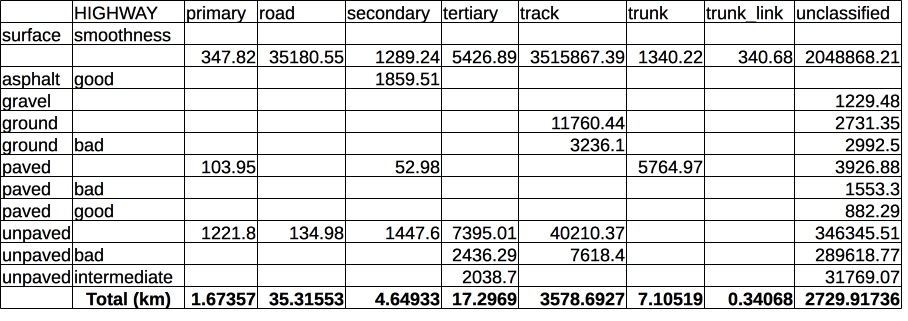
84 KB | Results of GroupStats on the lengths of various categories of roads, with respect to type. | 1 |
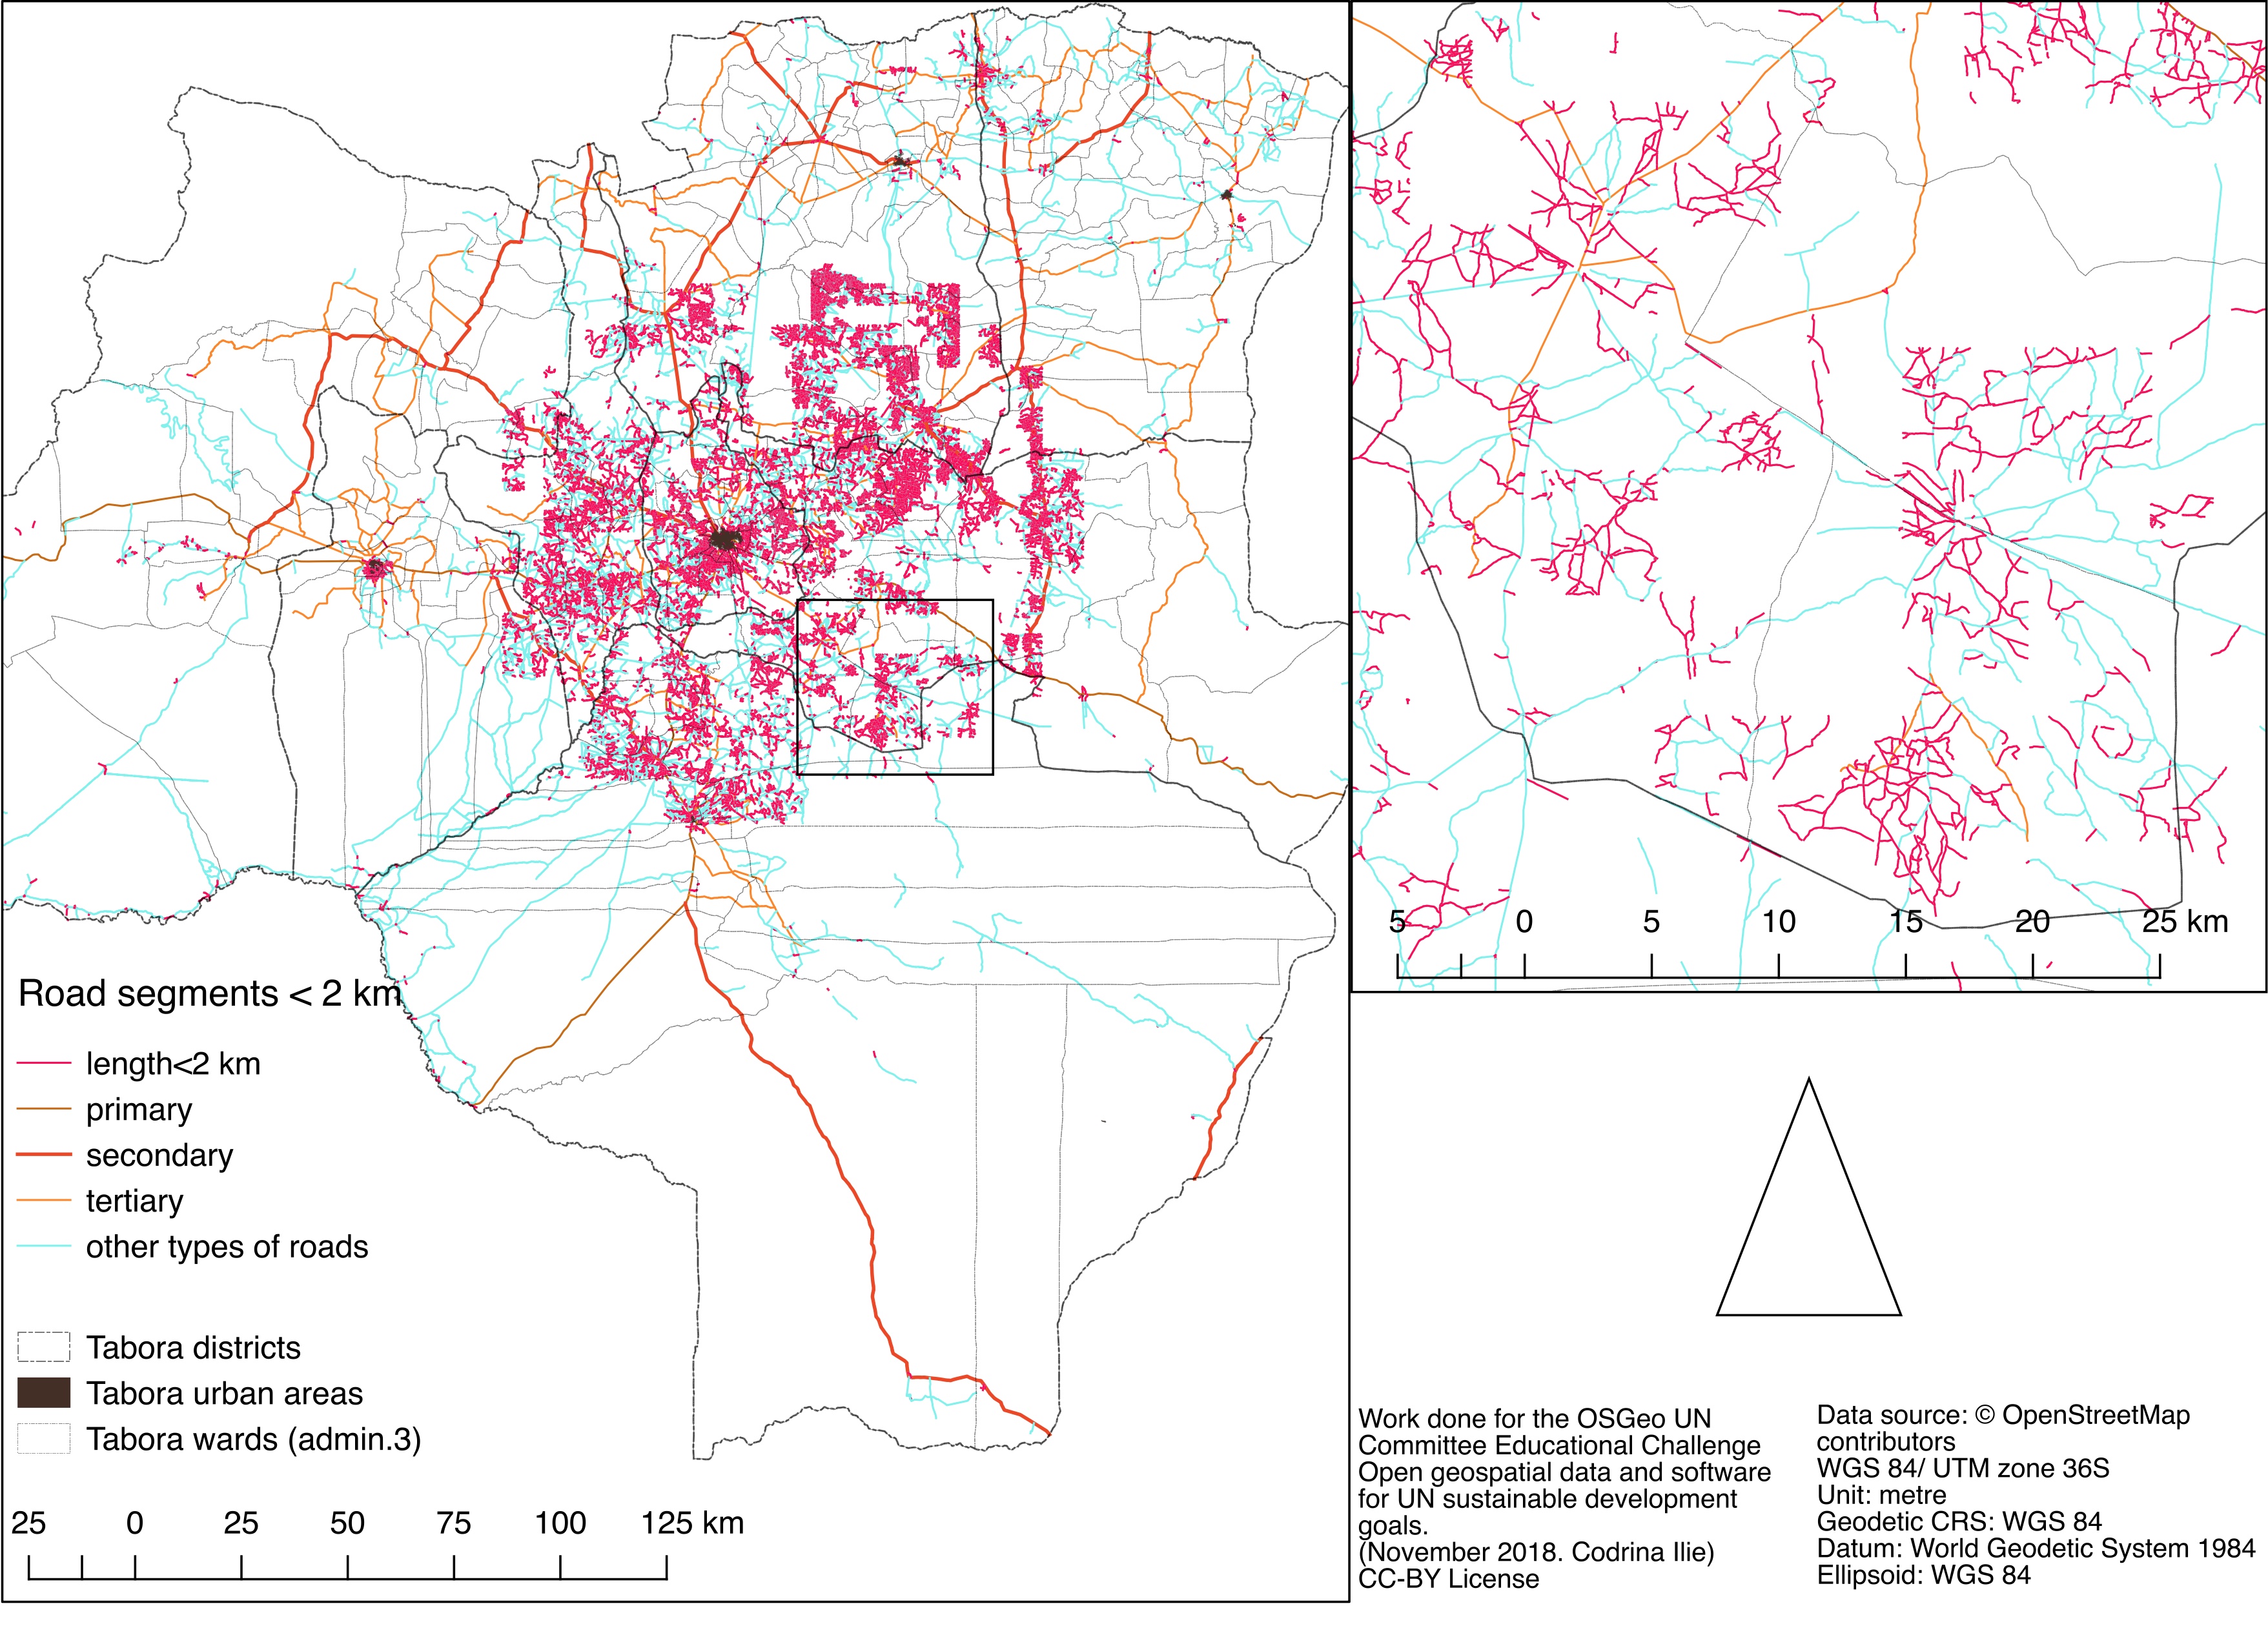
| 03:00, 21 January 2019 | Fig13 length2000 initial.jpg (file) |  |
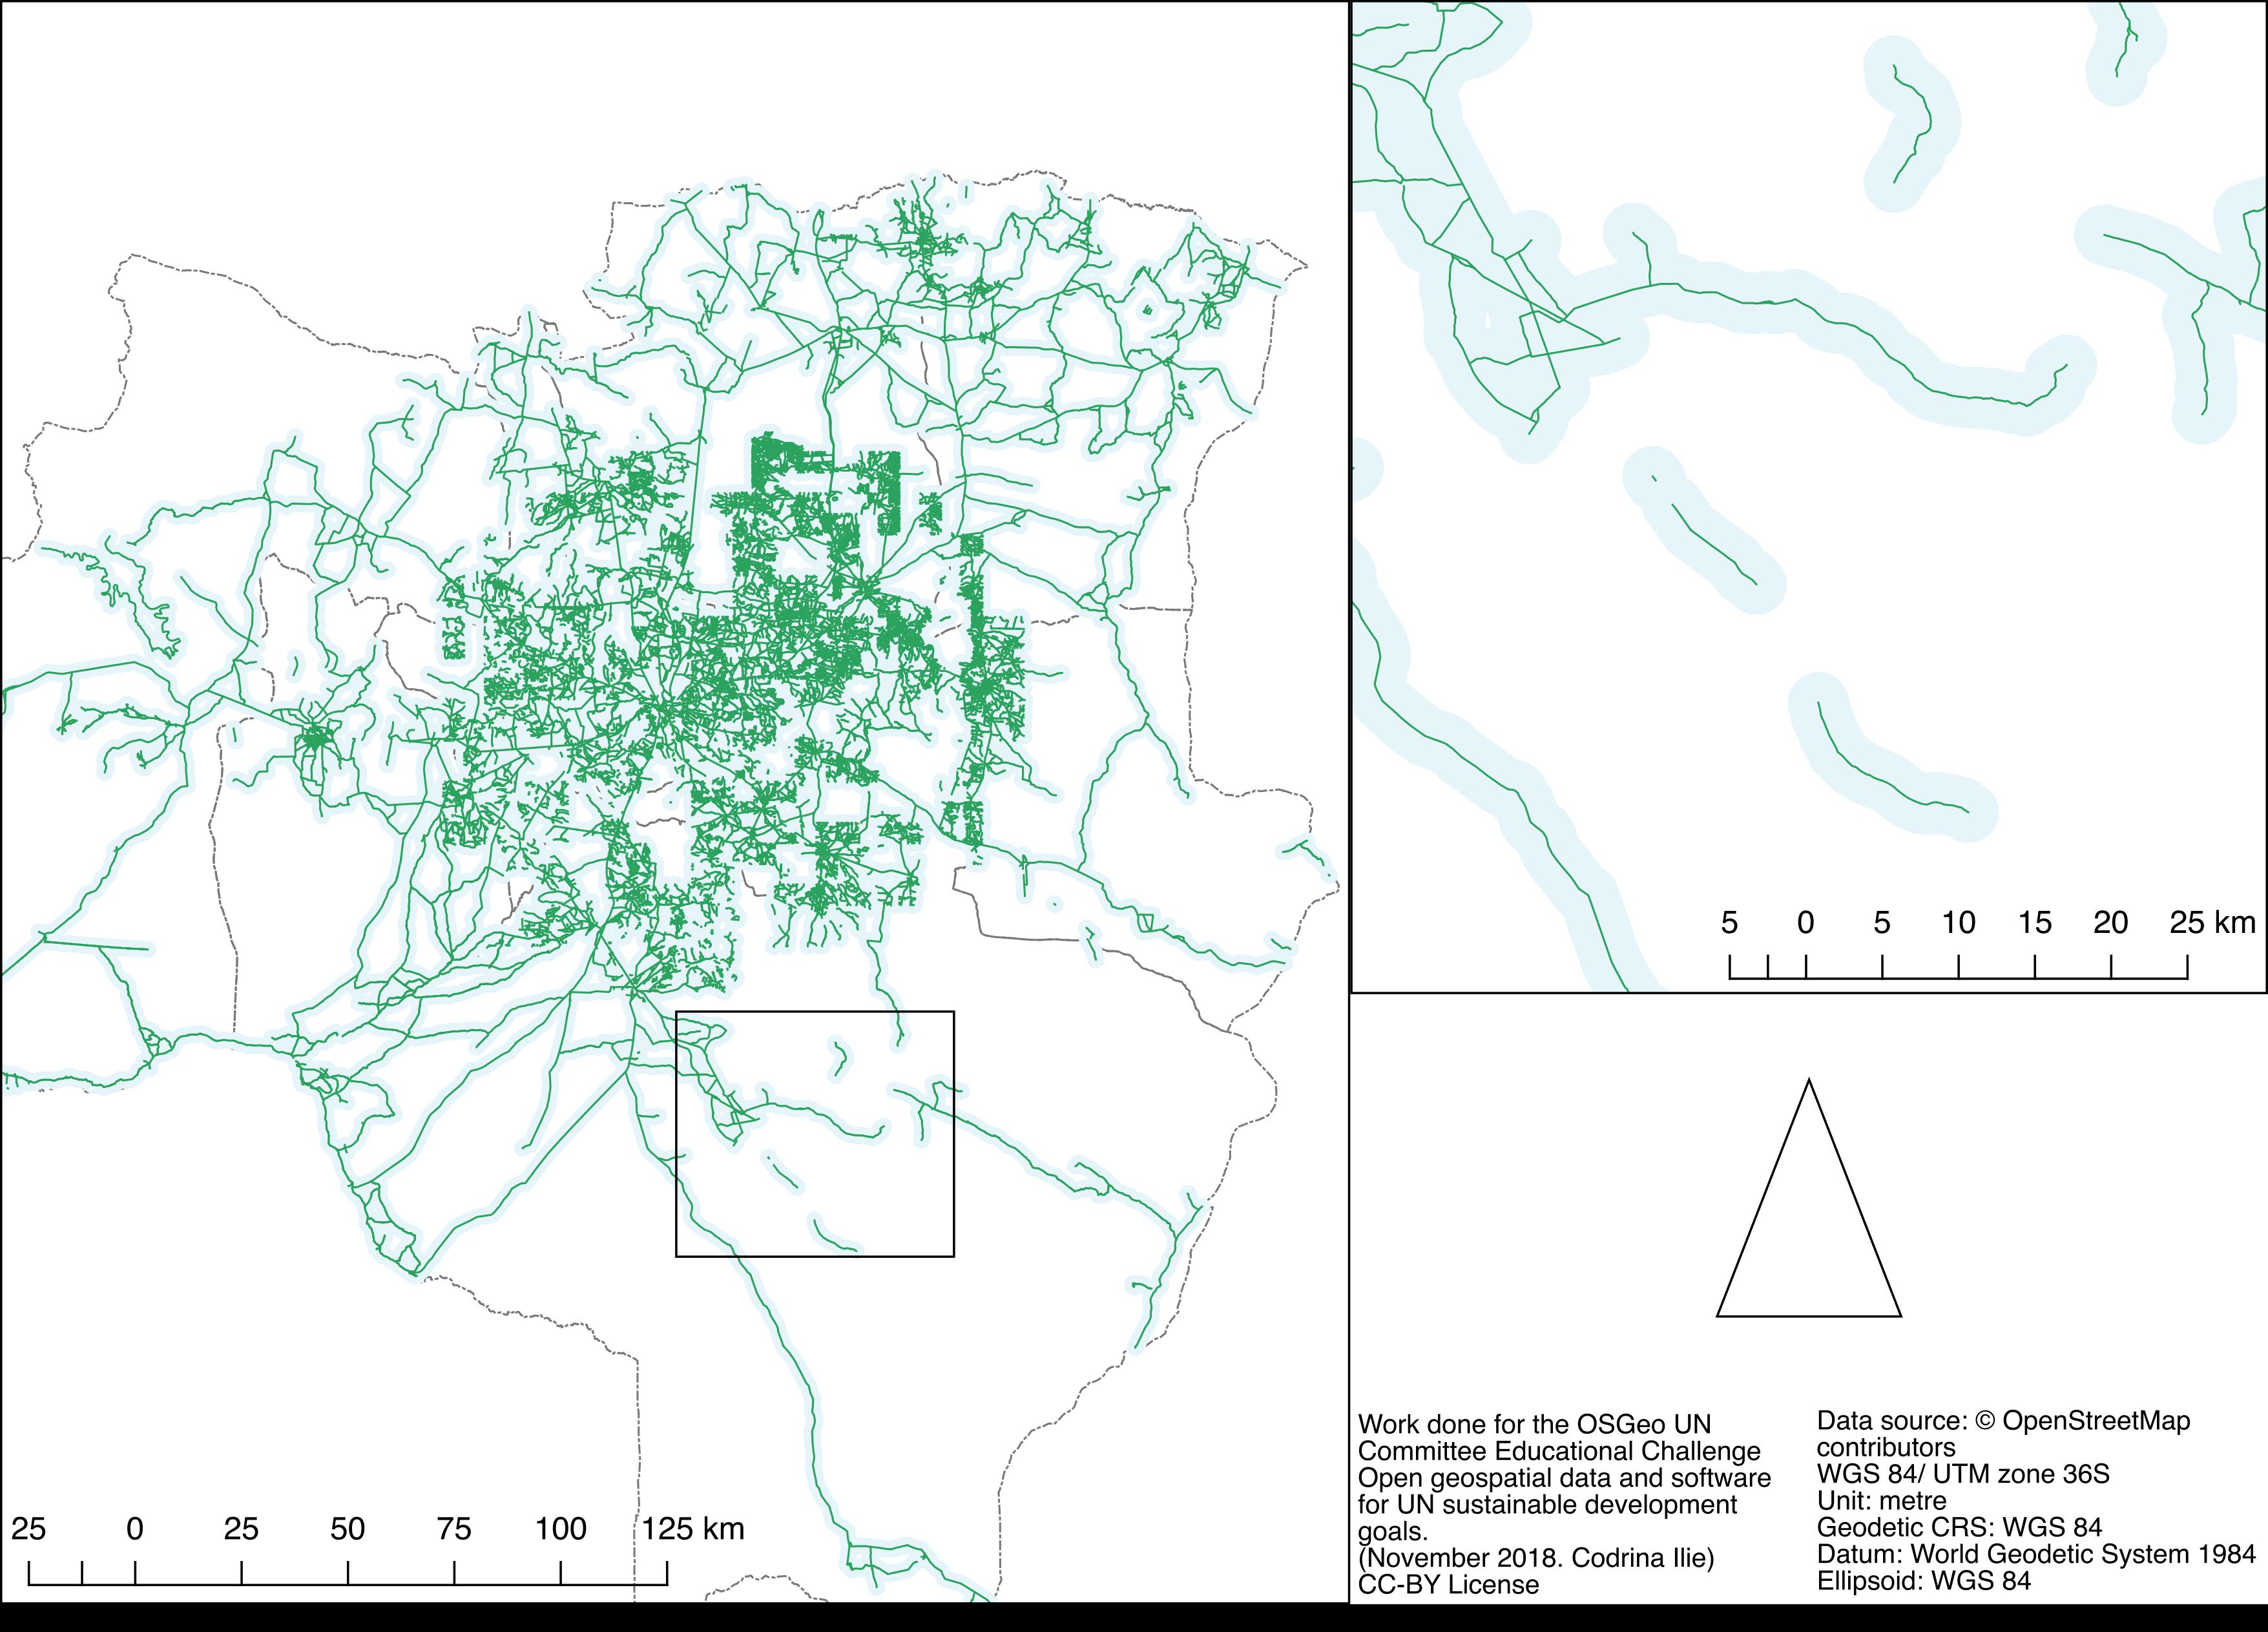
1.93 MB | Spatial distribution of all OSM road segments shorter than 2km. | 1 |
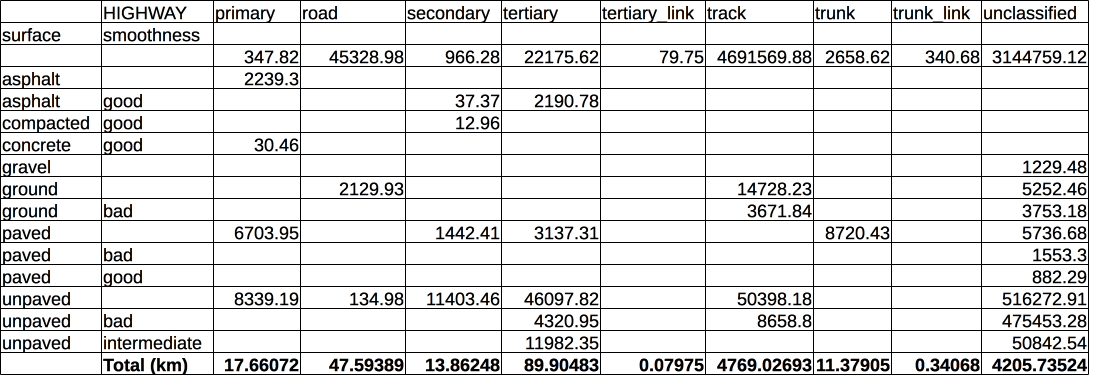
| 03:03, 21 January 2019 | Fig14 length2000.png (file) |  |
67 KB | The total length of OSM road segments shorter than 2 km, by road, surface and smoothness type, after the merge operation - results of GroupStats | 1 |
| 03:04, 21 January 2019 | Fig15 length2000DiffStats.png (file) |  |
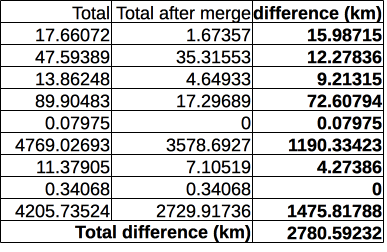
36 KB | The difference between the total length of road segments shorter than 2 km before and after running MergeLines plugin - results of GroupStats. | 1 |
| 03:07, 21 January 2019 | Fig16 buffer initial.jpeg (file) |  |
709 KB | Spatial distribution of unconnected road buffers. | 1 |
| 03:09, 21 January 2019 | Fig17 buffer RAI.jpeg (file) |  |
709 KB | Example of unconnected road buffers that are intersecting the county border. | 1 |
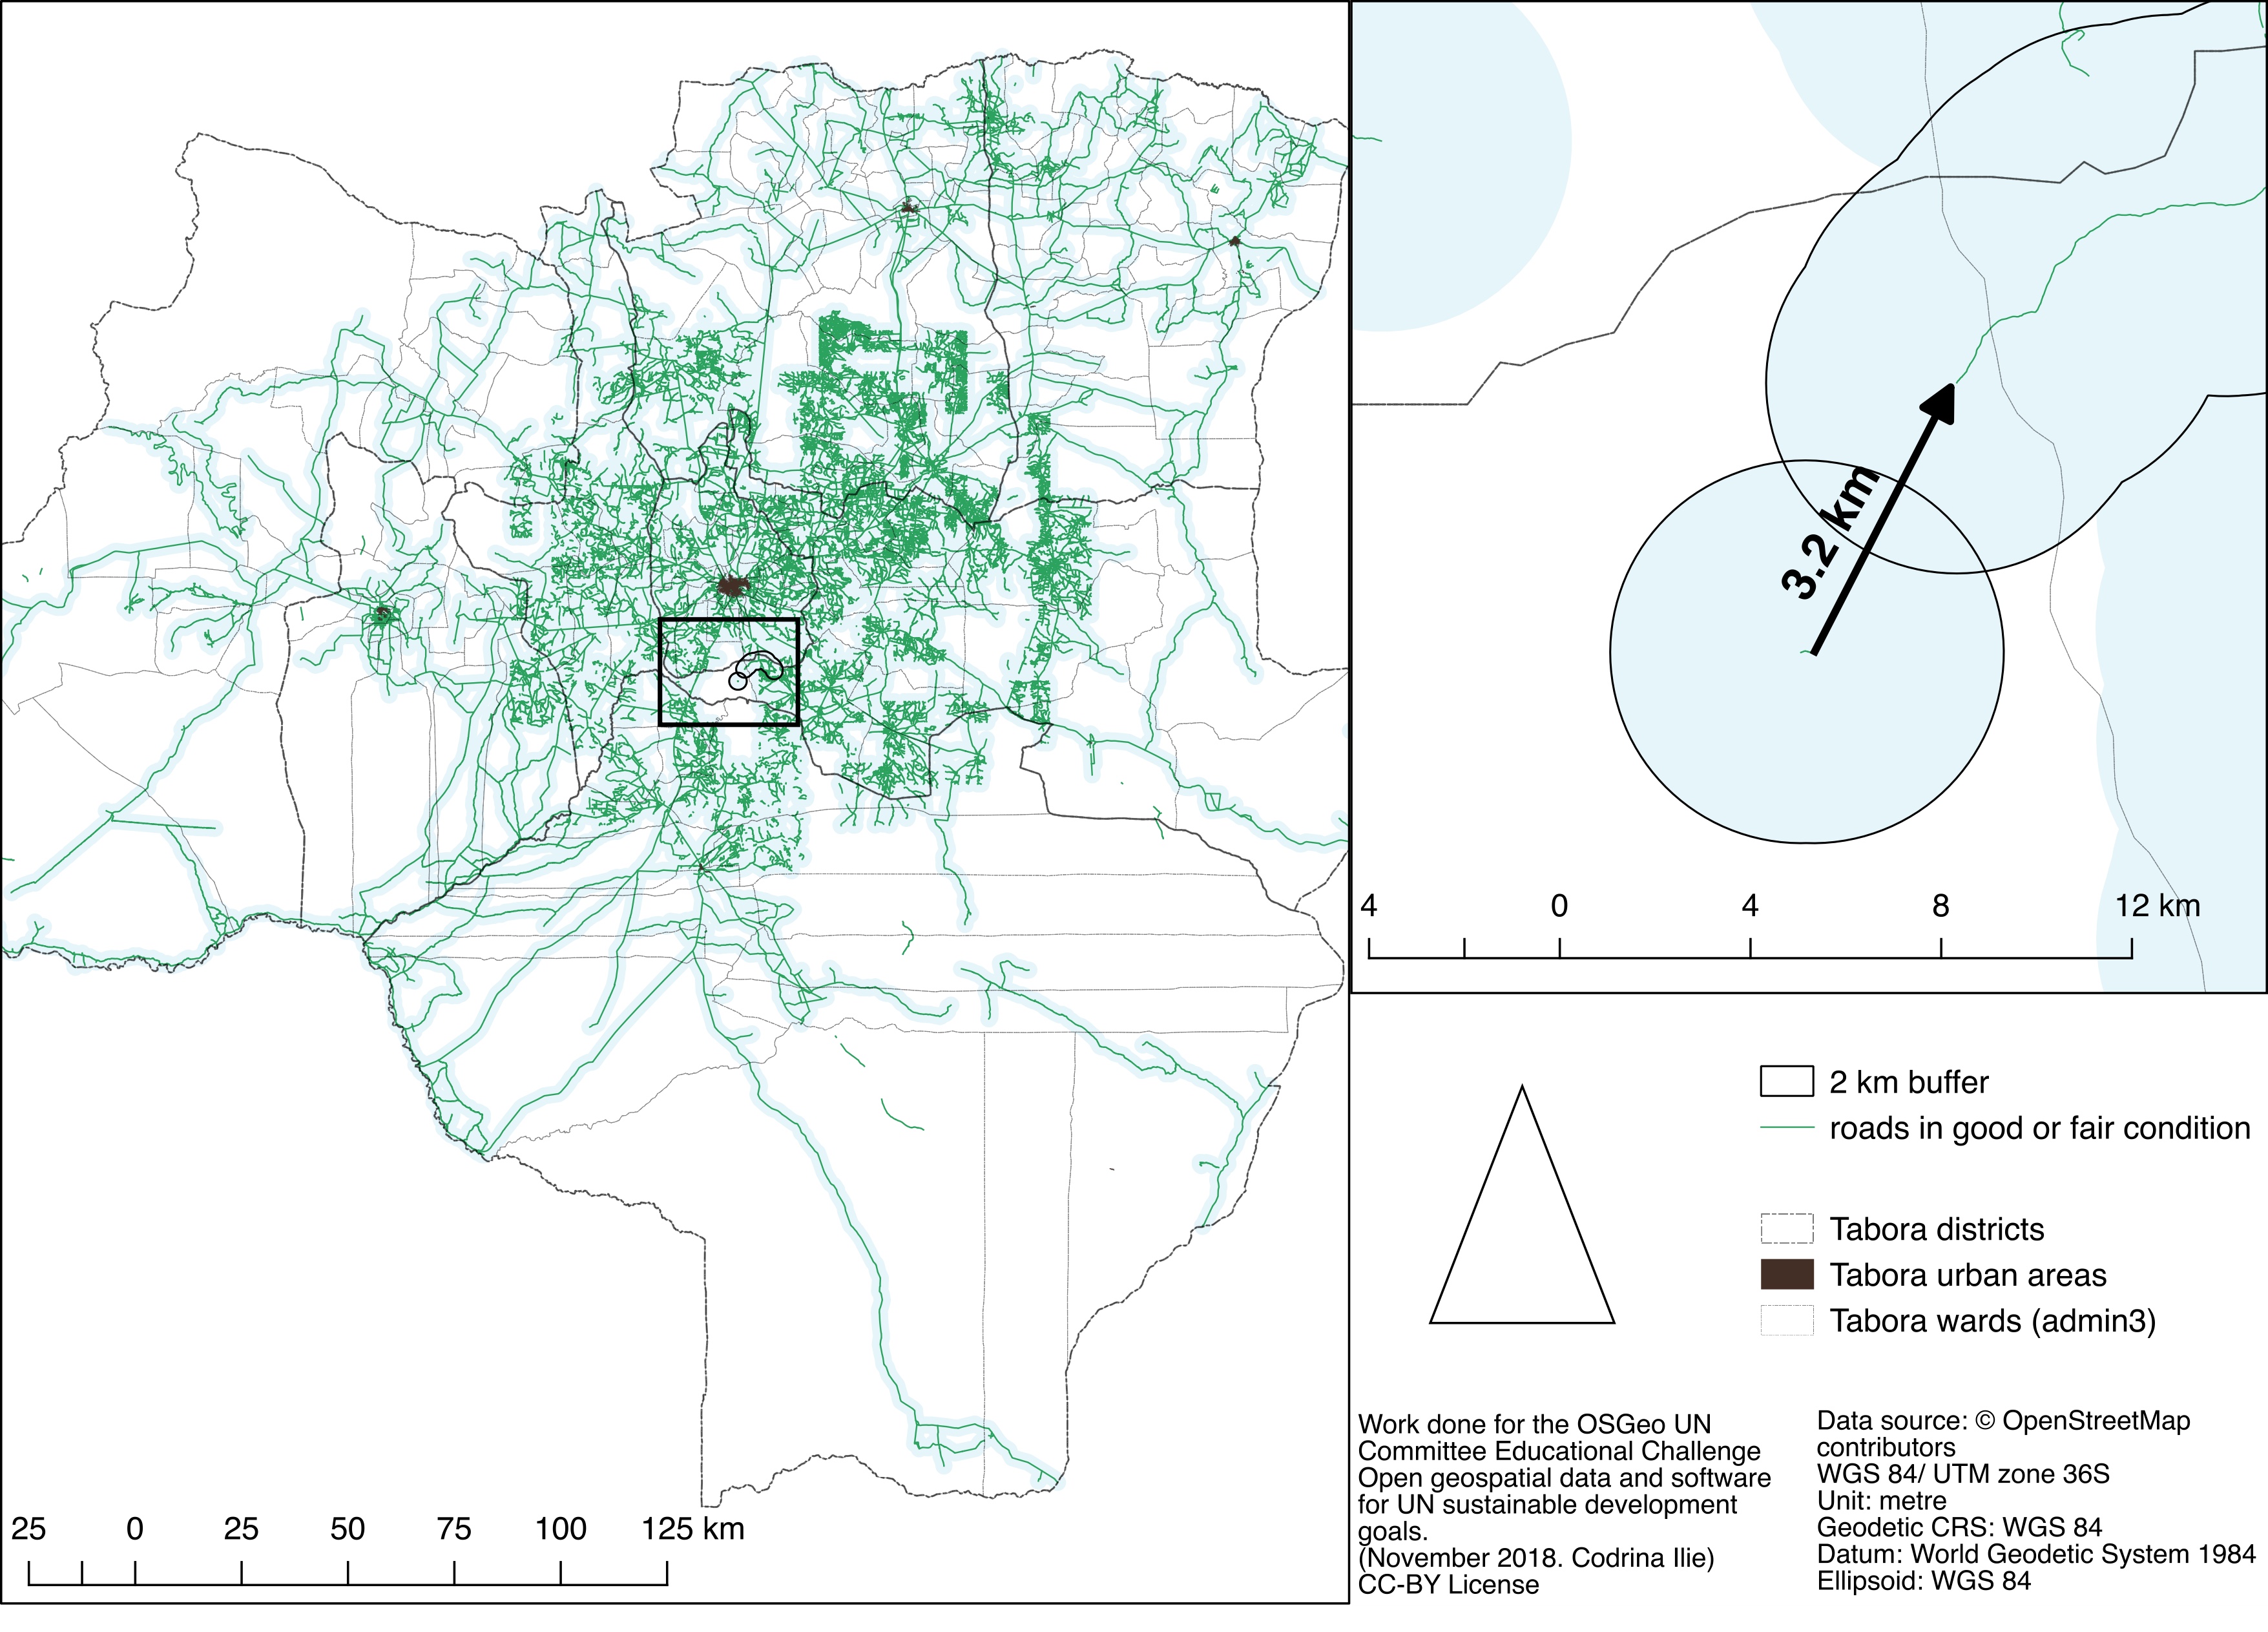
| 03:16, 21 January 2019 | Fig18 buffer-2km.jpg (file) |  |
1.63 MB | Exemplification of issues determined by the poor connectivity of road network | 1 |
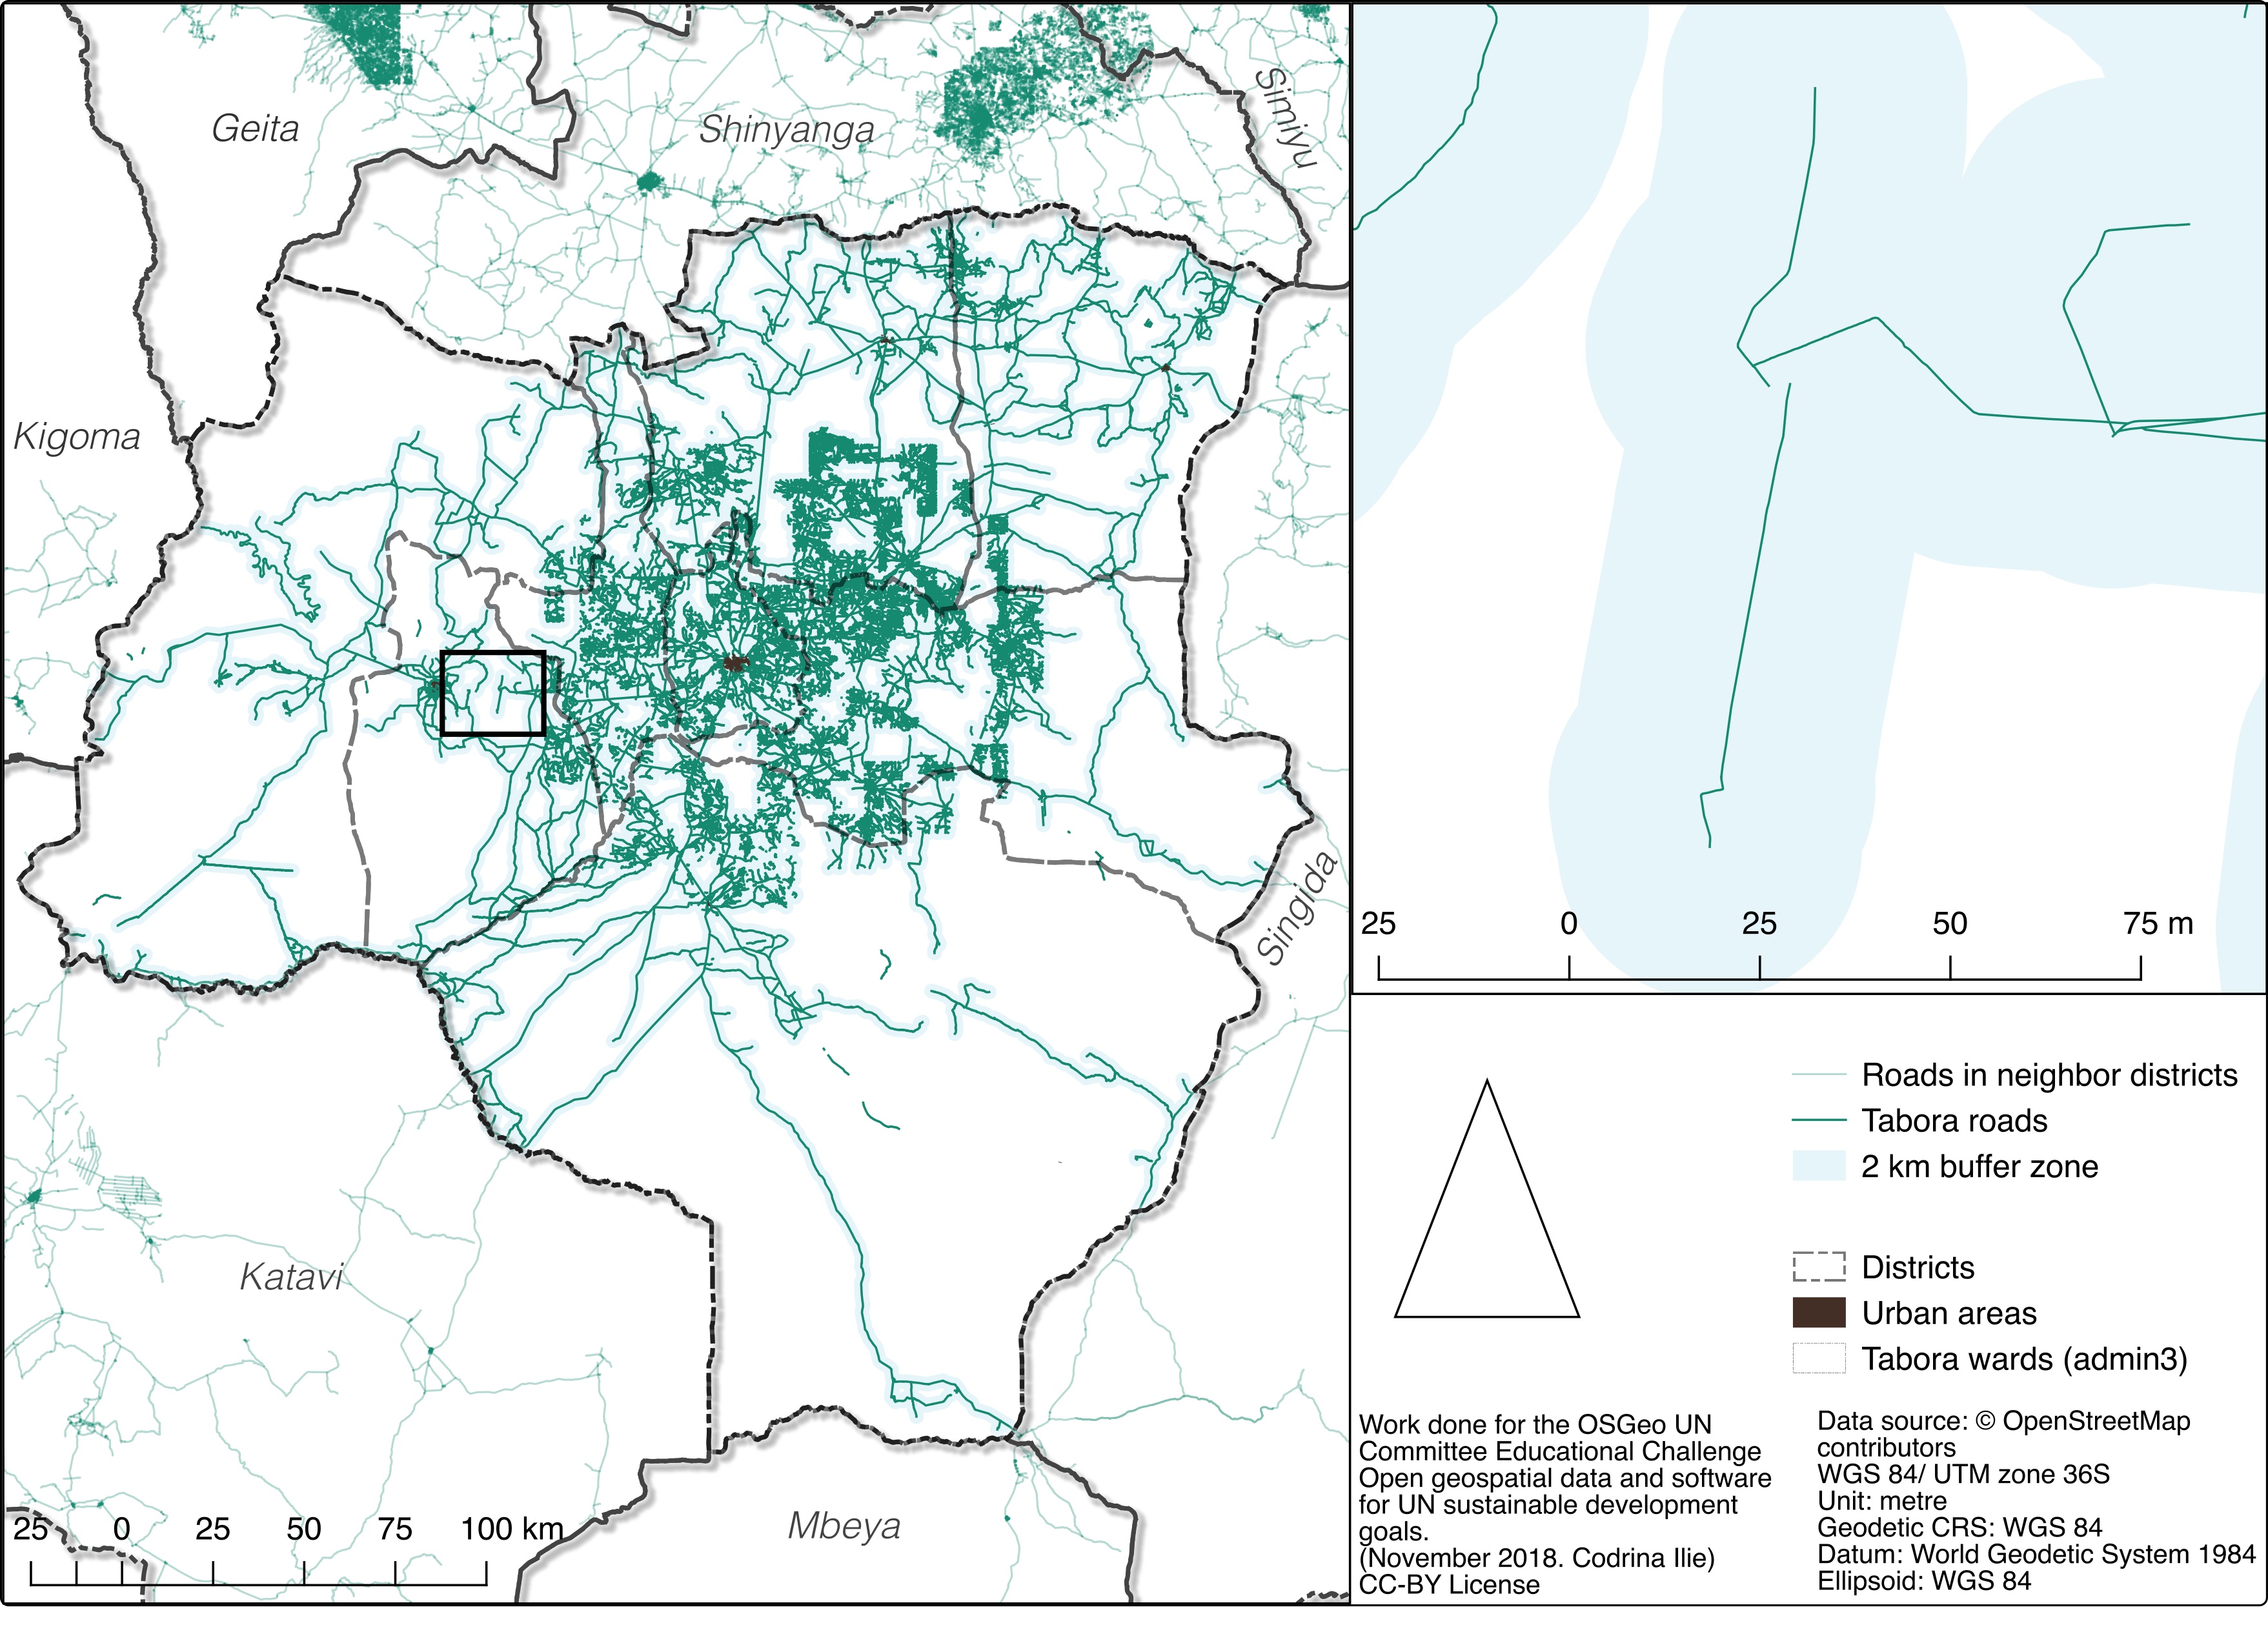
| 03:18, 21 January 2019 | Fig19 buffer-2km.jpg (file) |  |
1.64 MB | Unconnected road segment to be considered in the Tabora district RAI calculation | 1 |
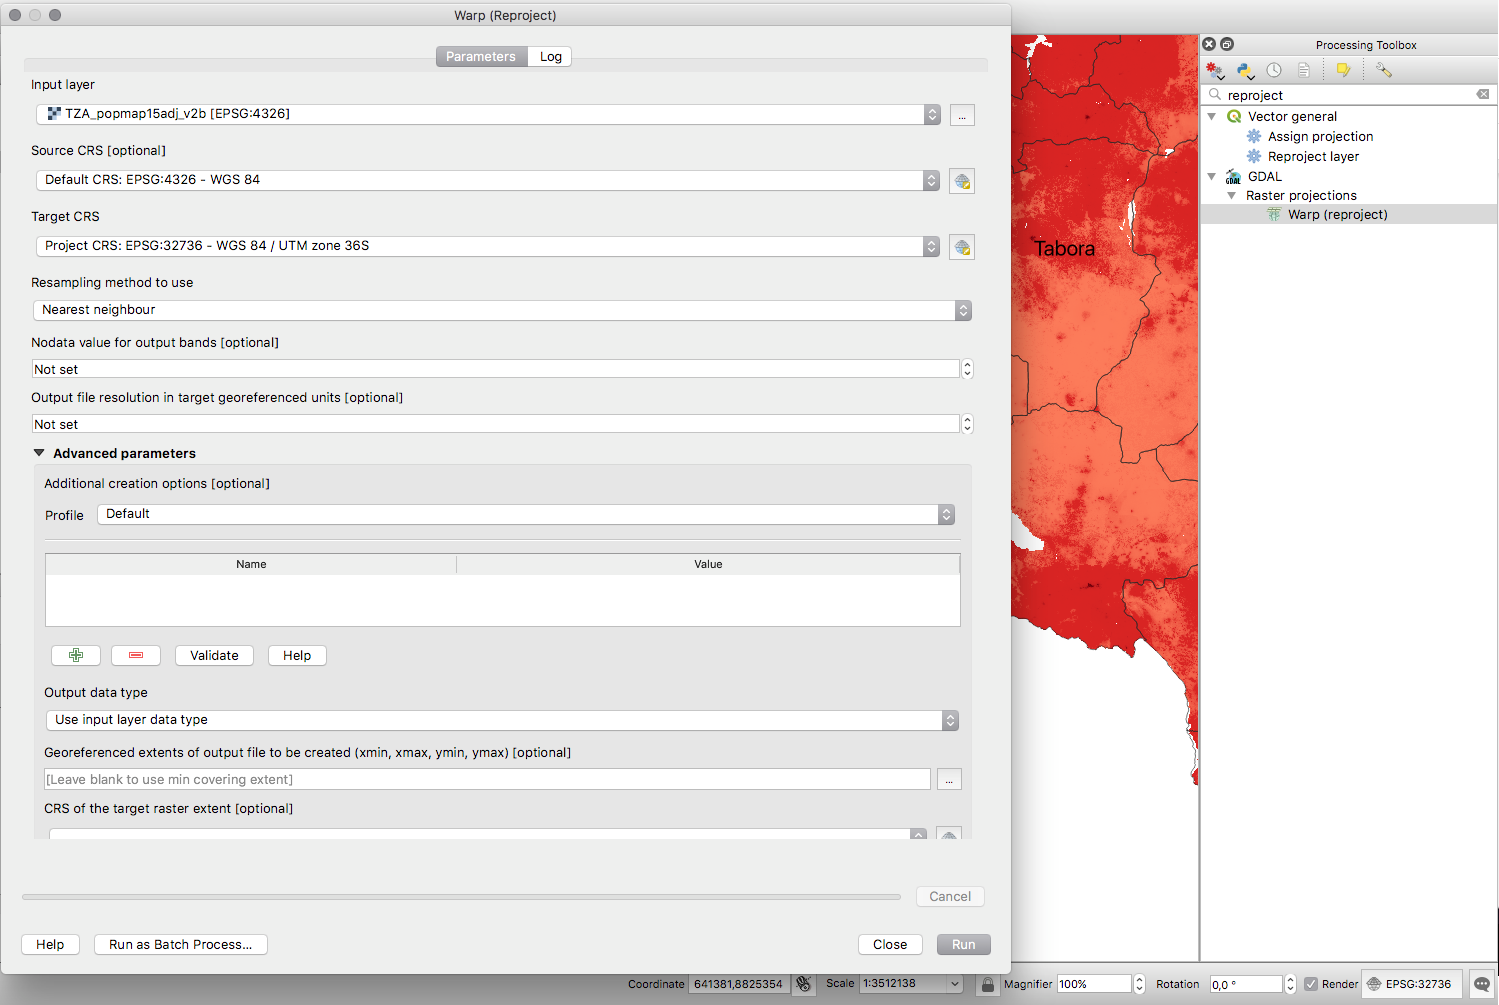
| 01:49, 21 January 2019 | Fig1 reproject.png (file) |  |
383 KB | Screen capture of the reproject tool for a raster dataset, identified in the Processing toolbox using the search functionality. | 1 |
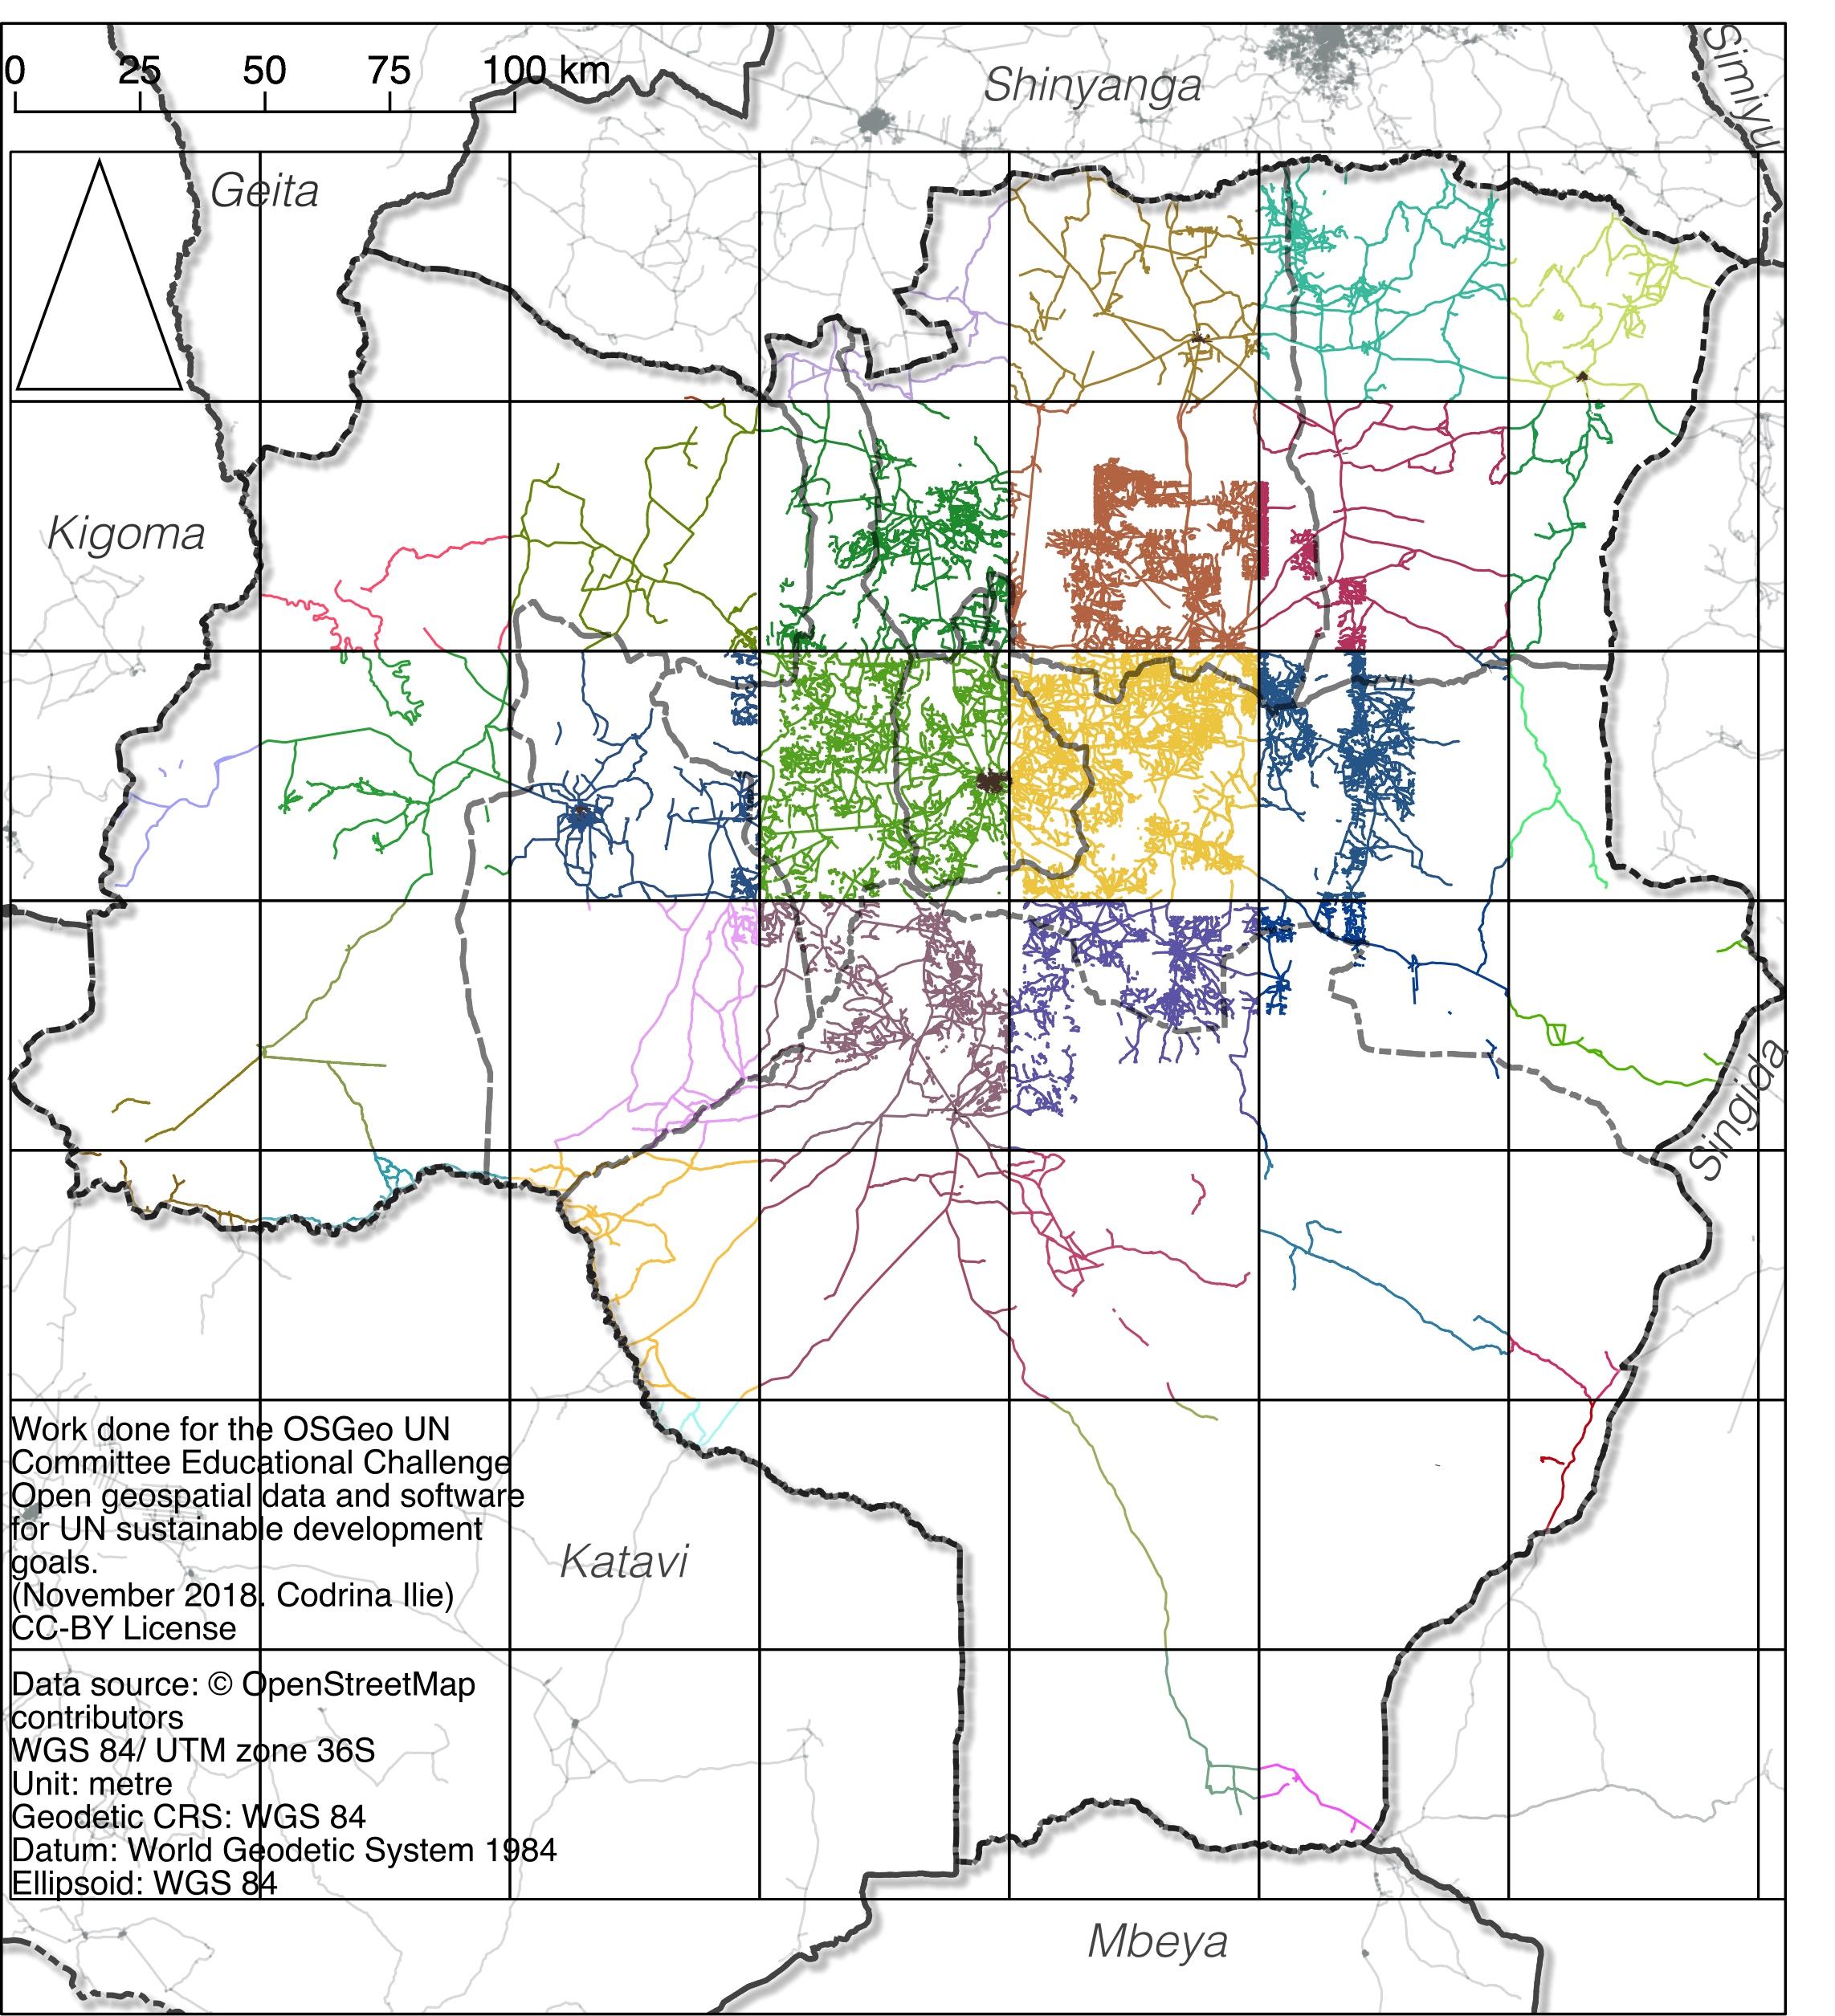
| 03:21, 21 January 2019 | Fig20 roads GRID.jpg (file) |  |
1.47 MB | The 50X50KM grid and the corresponding road segments | 1 |
| 03:23, 21 January 2019 | Fig21 roads GRID results.jpg (file) |  |
1.86 MB | Result of the subnet creation script | 1 |
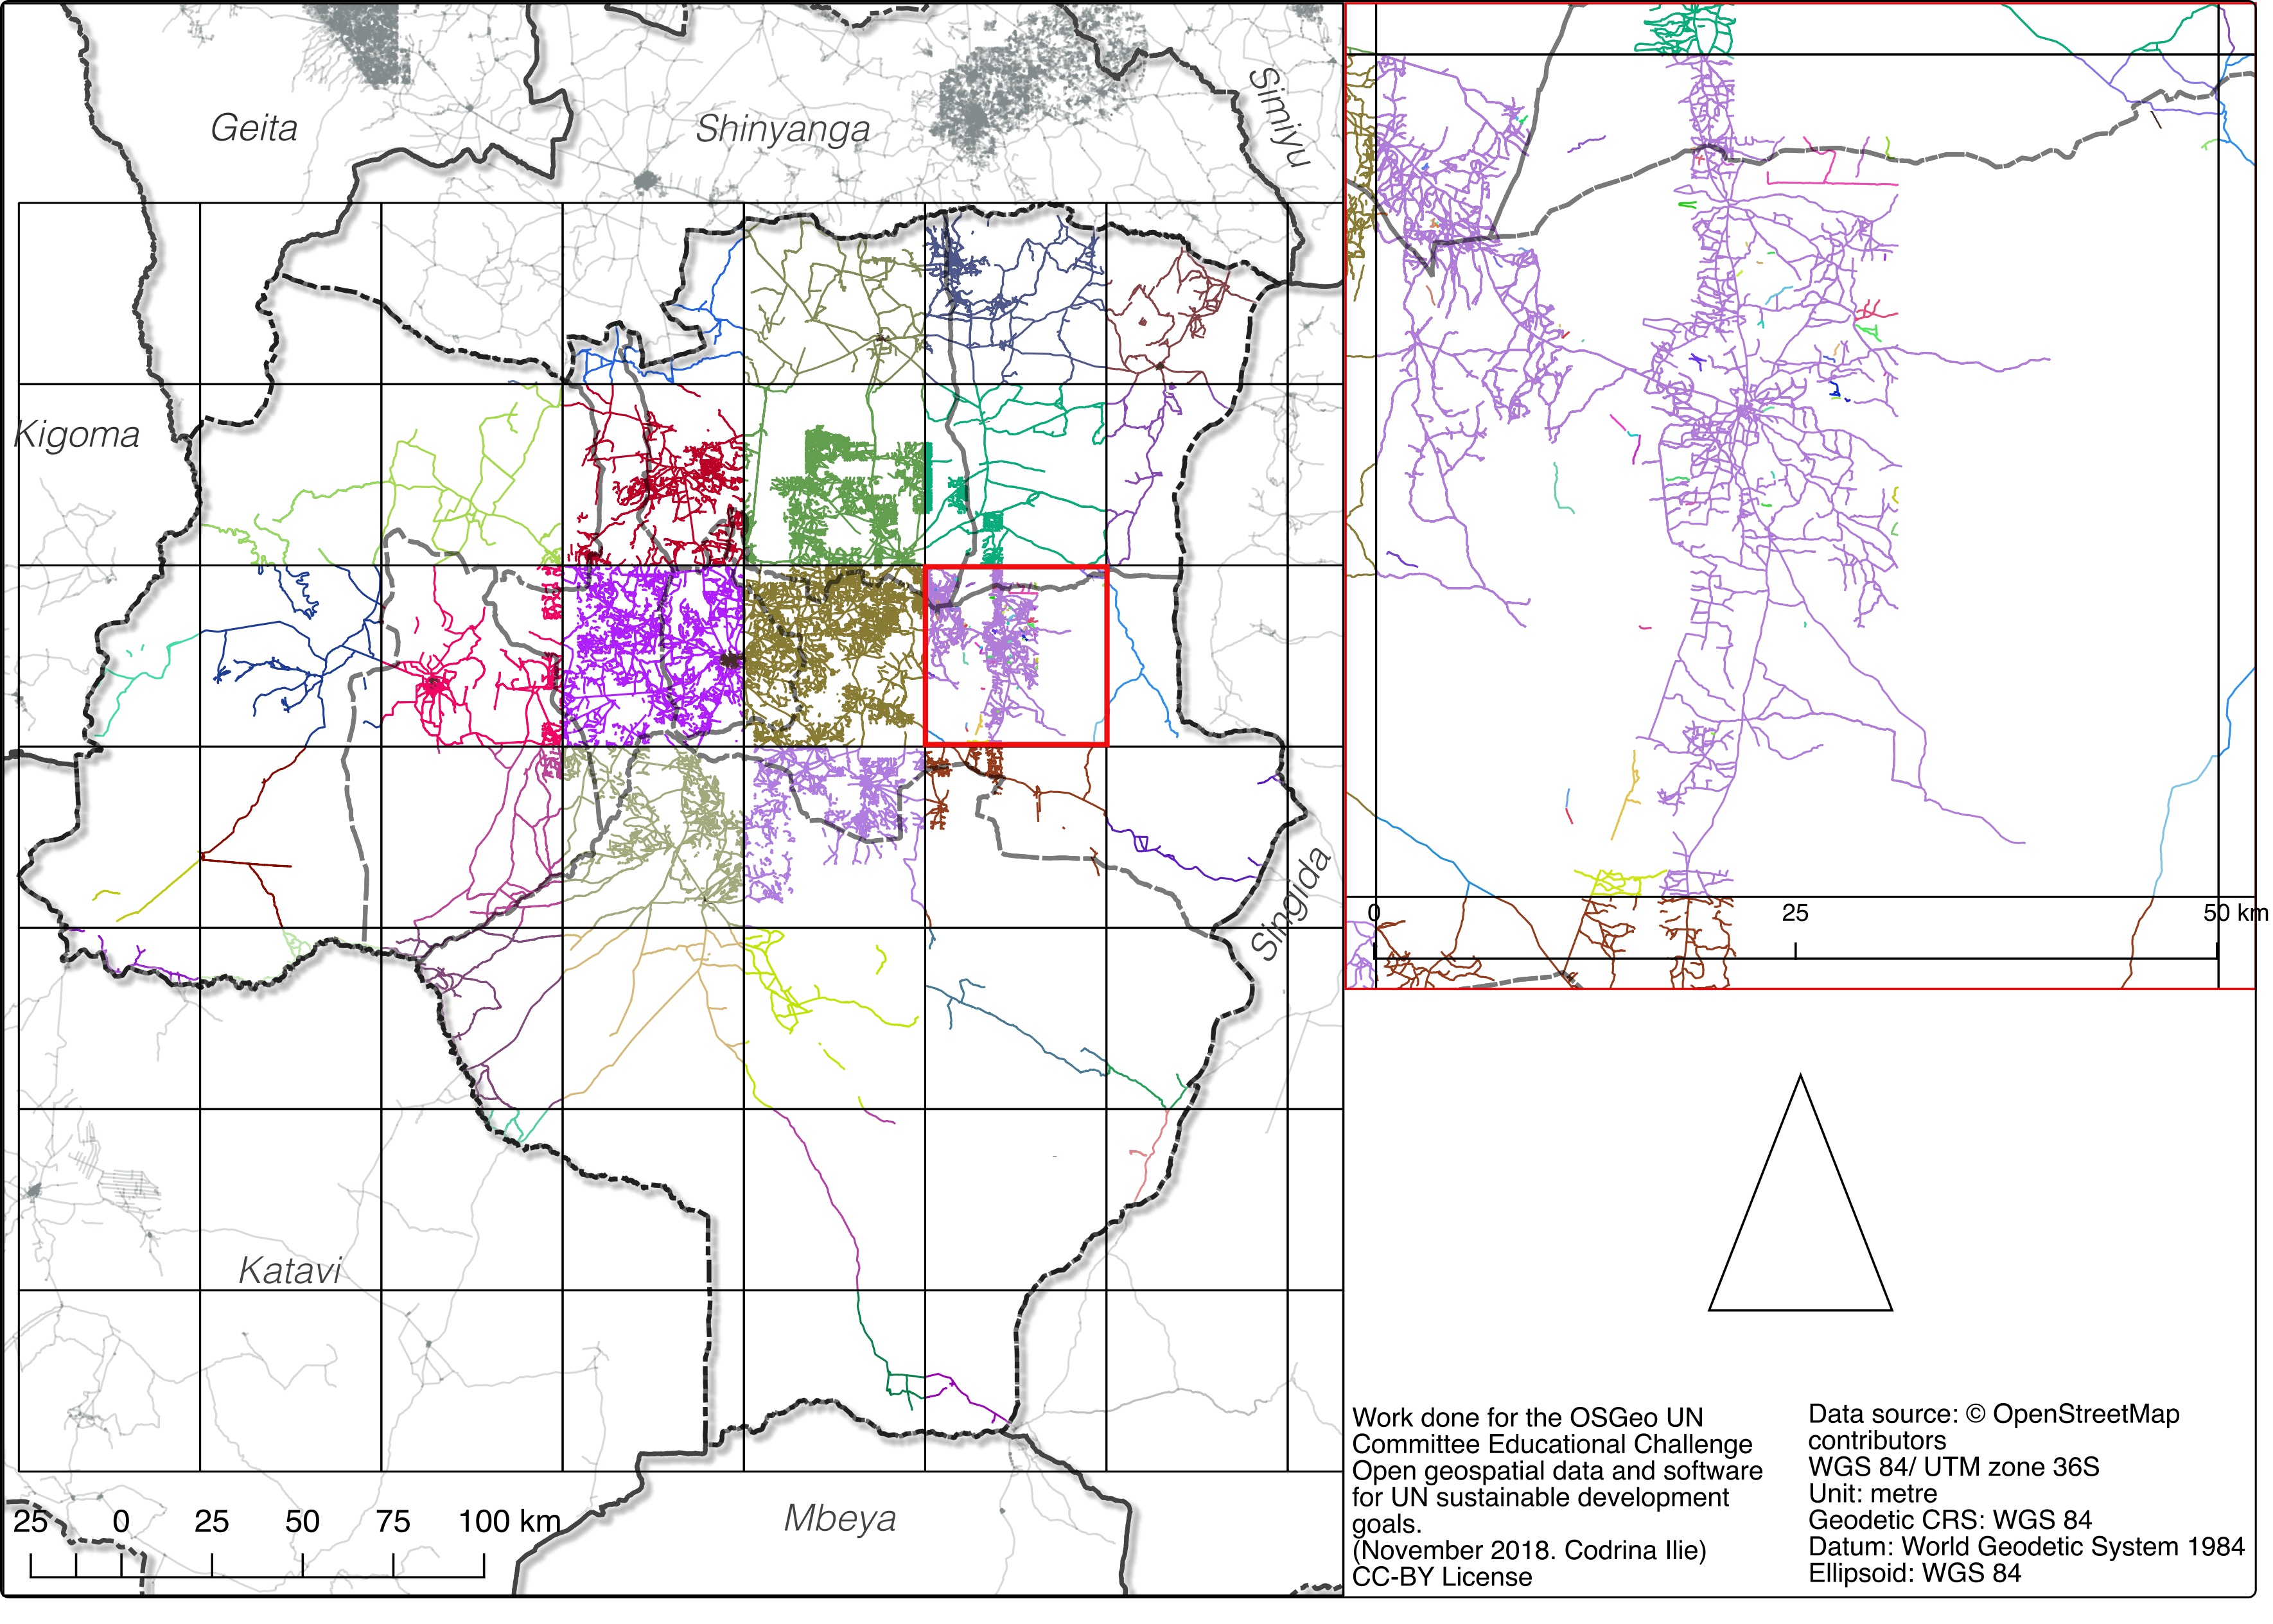
| 03:25, 21 January 2019 | Fig22 networks-2000.jpg (file) |  |
1.78 MB | Spatial distribution of road segments of computed networks, by lengths (km) | 1 |
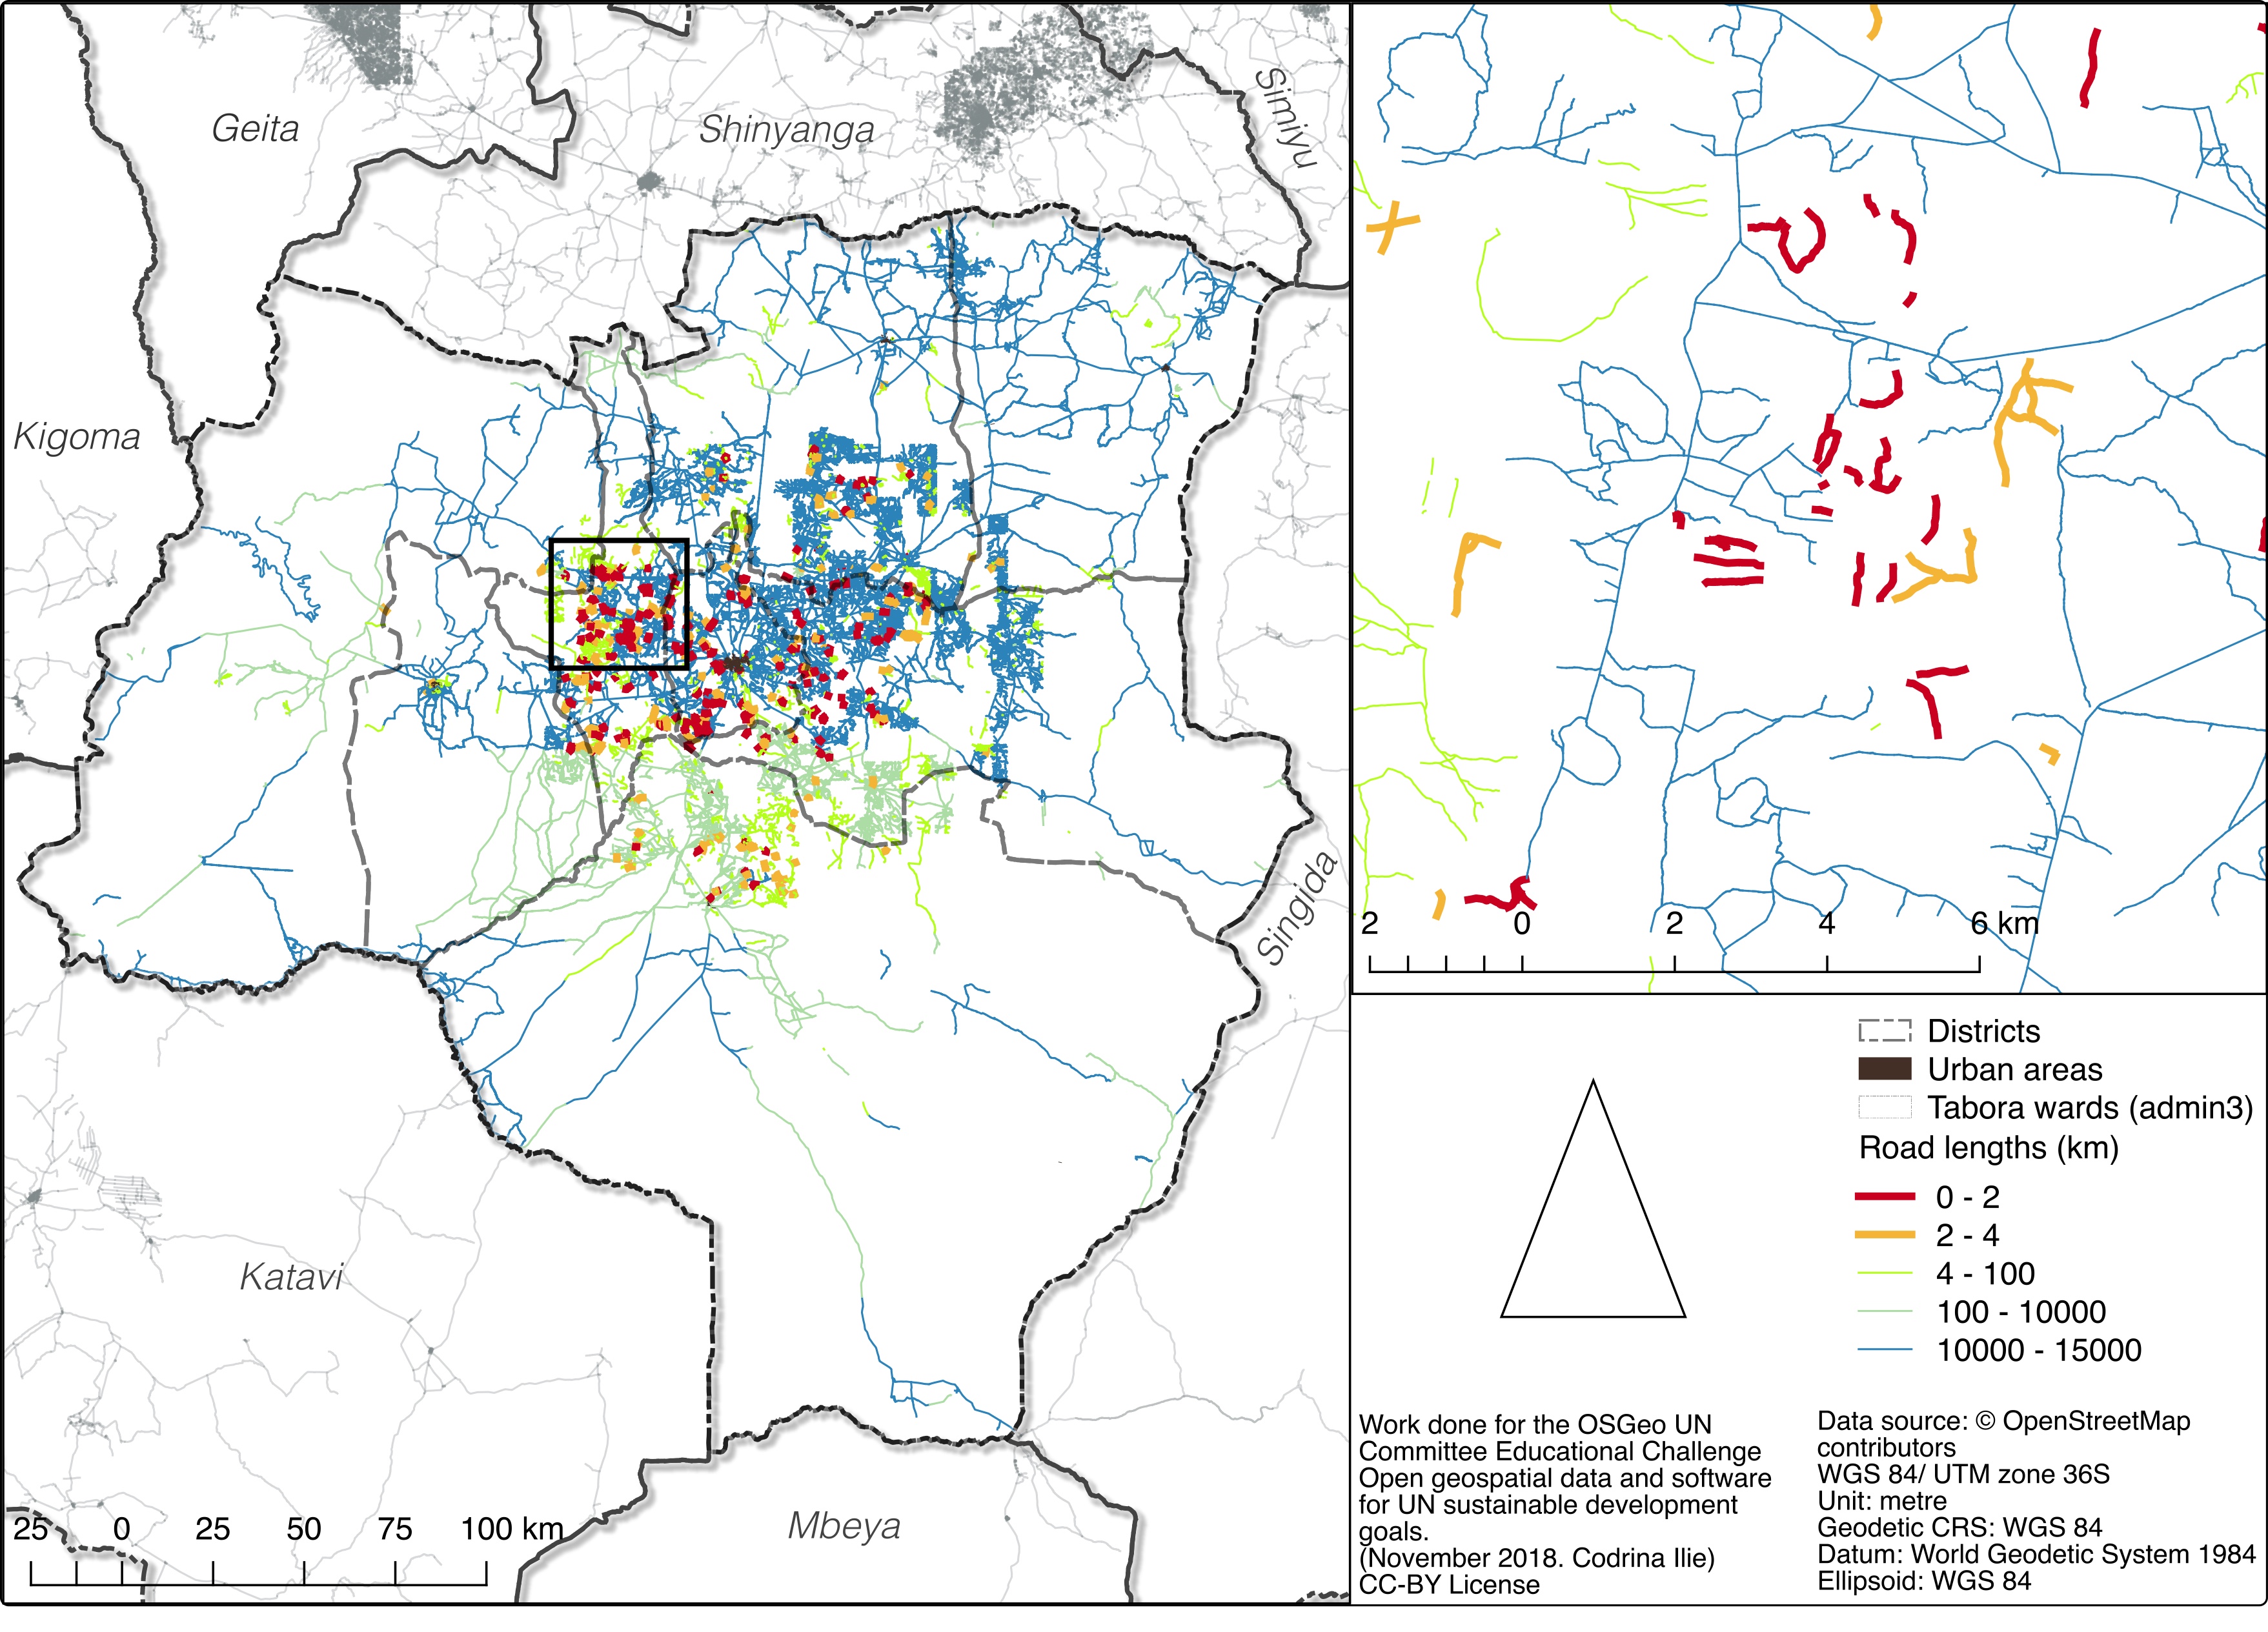
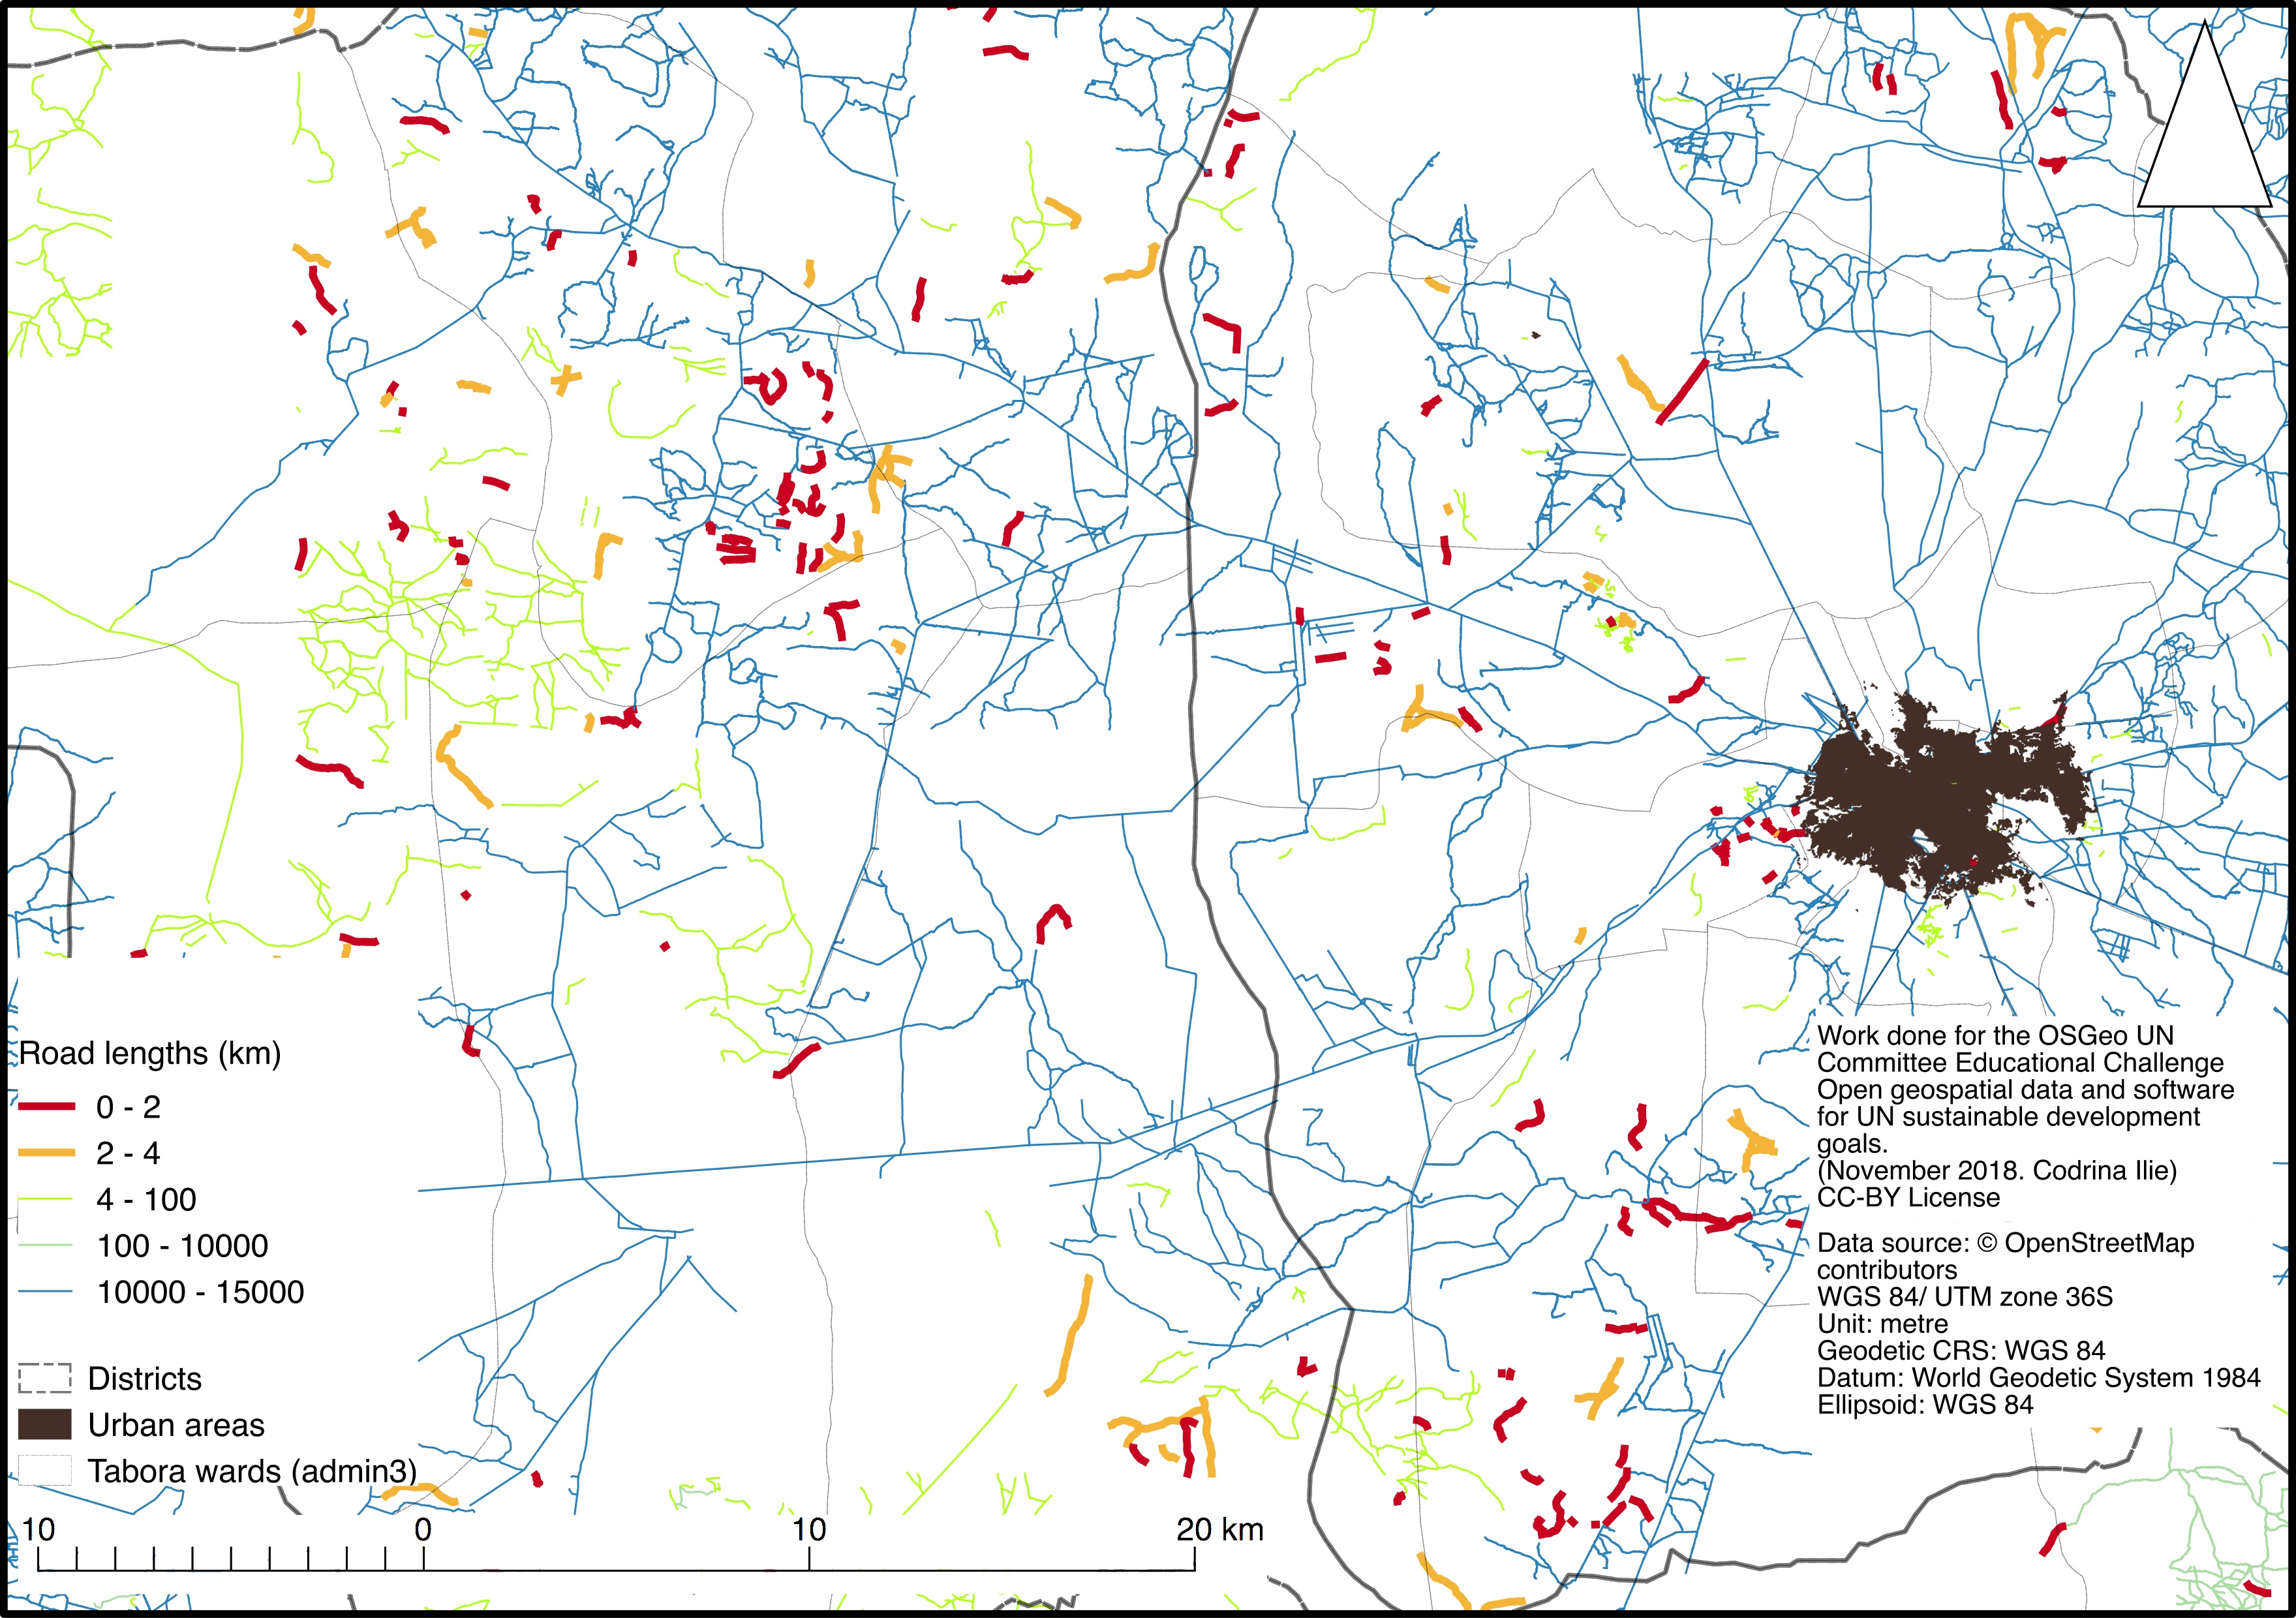
| 03:28, 21 January 2019 | Fig23 segments-2000.jpg (file) |  |
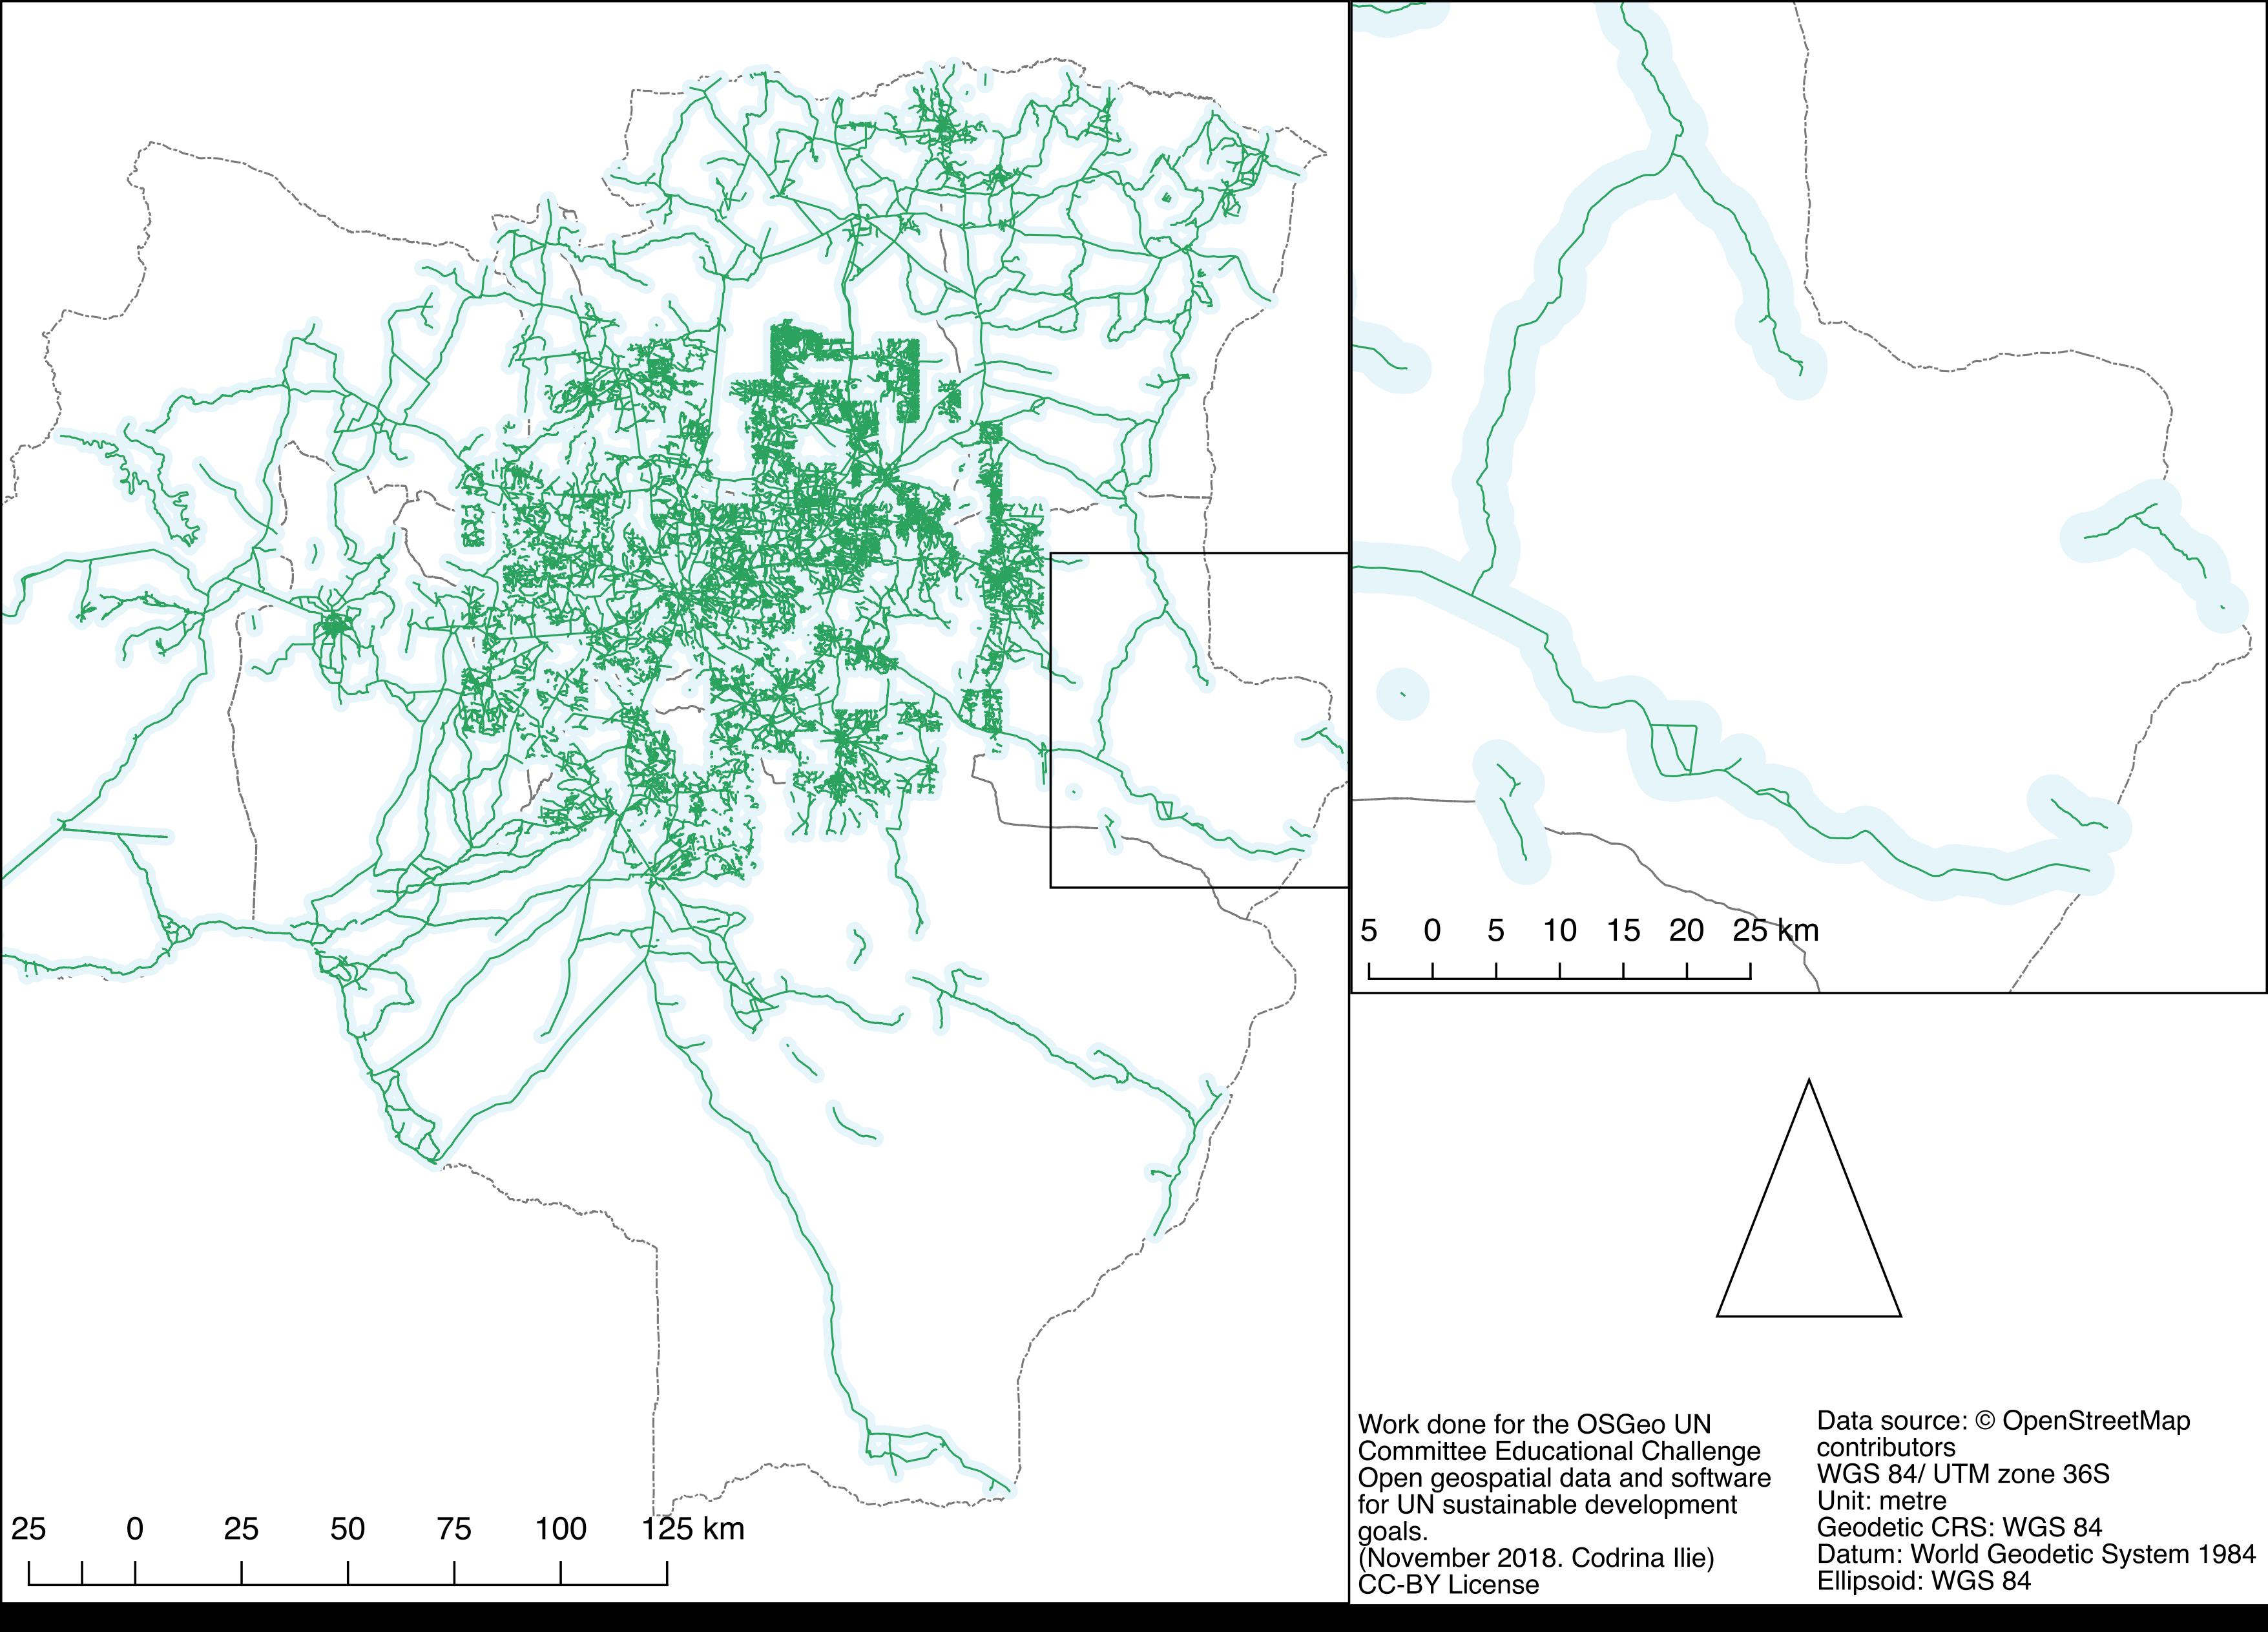
1.9 MB | Spatial distribution of the shorter than 2 km road segments | 1 |
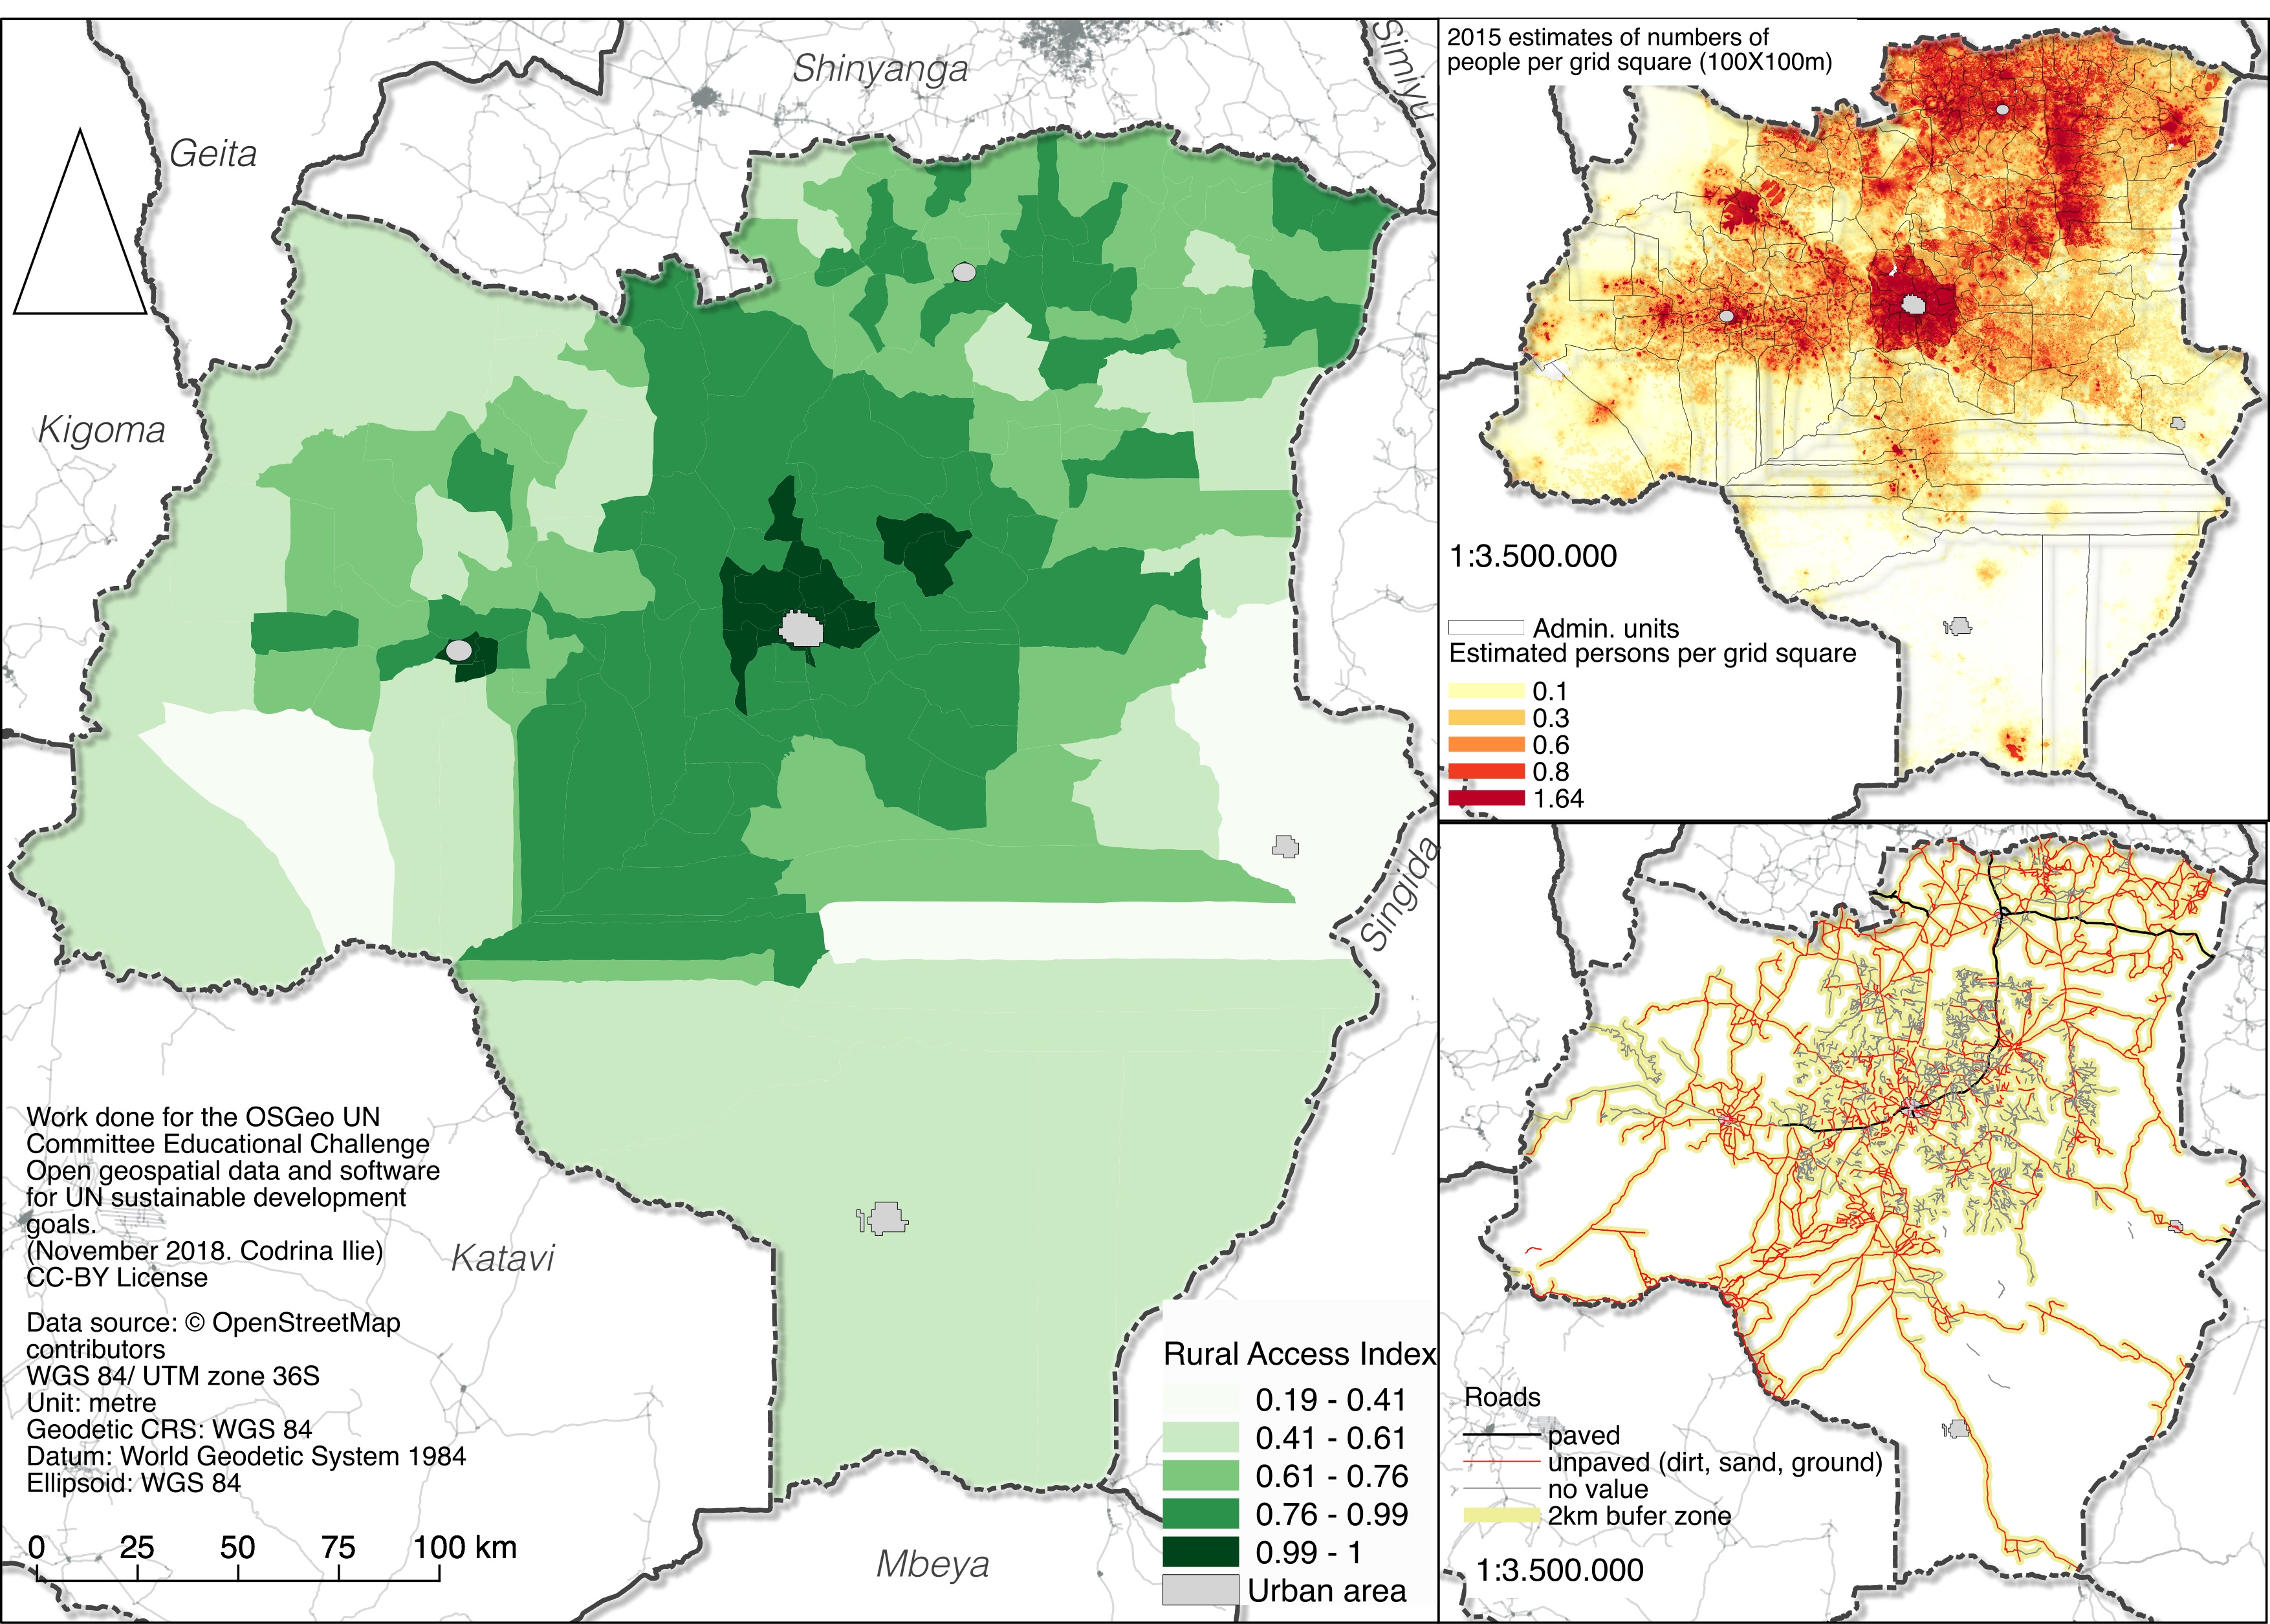
| 03:31, 21 January 2019 | Fig24 RAI.jpg (file) |  |
1.9 MB | Rural Access Index calculated for Tabora county, Tanzania. | 1 |
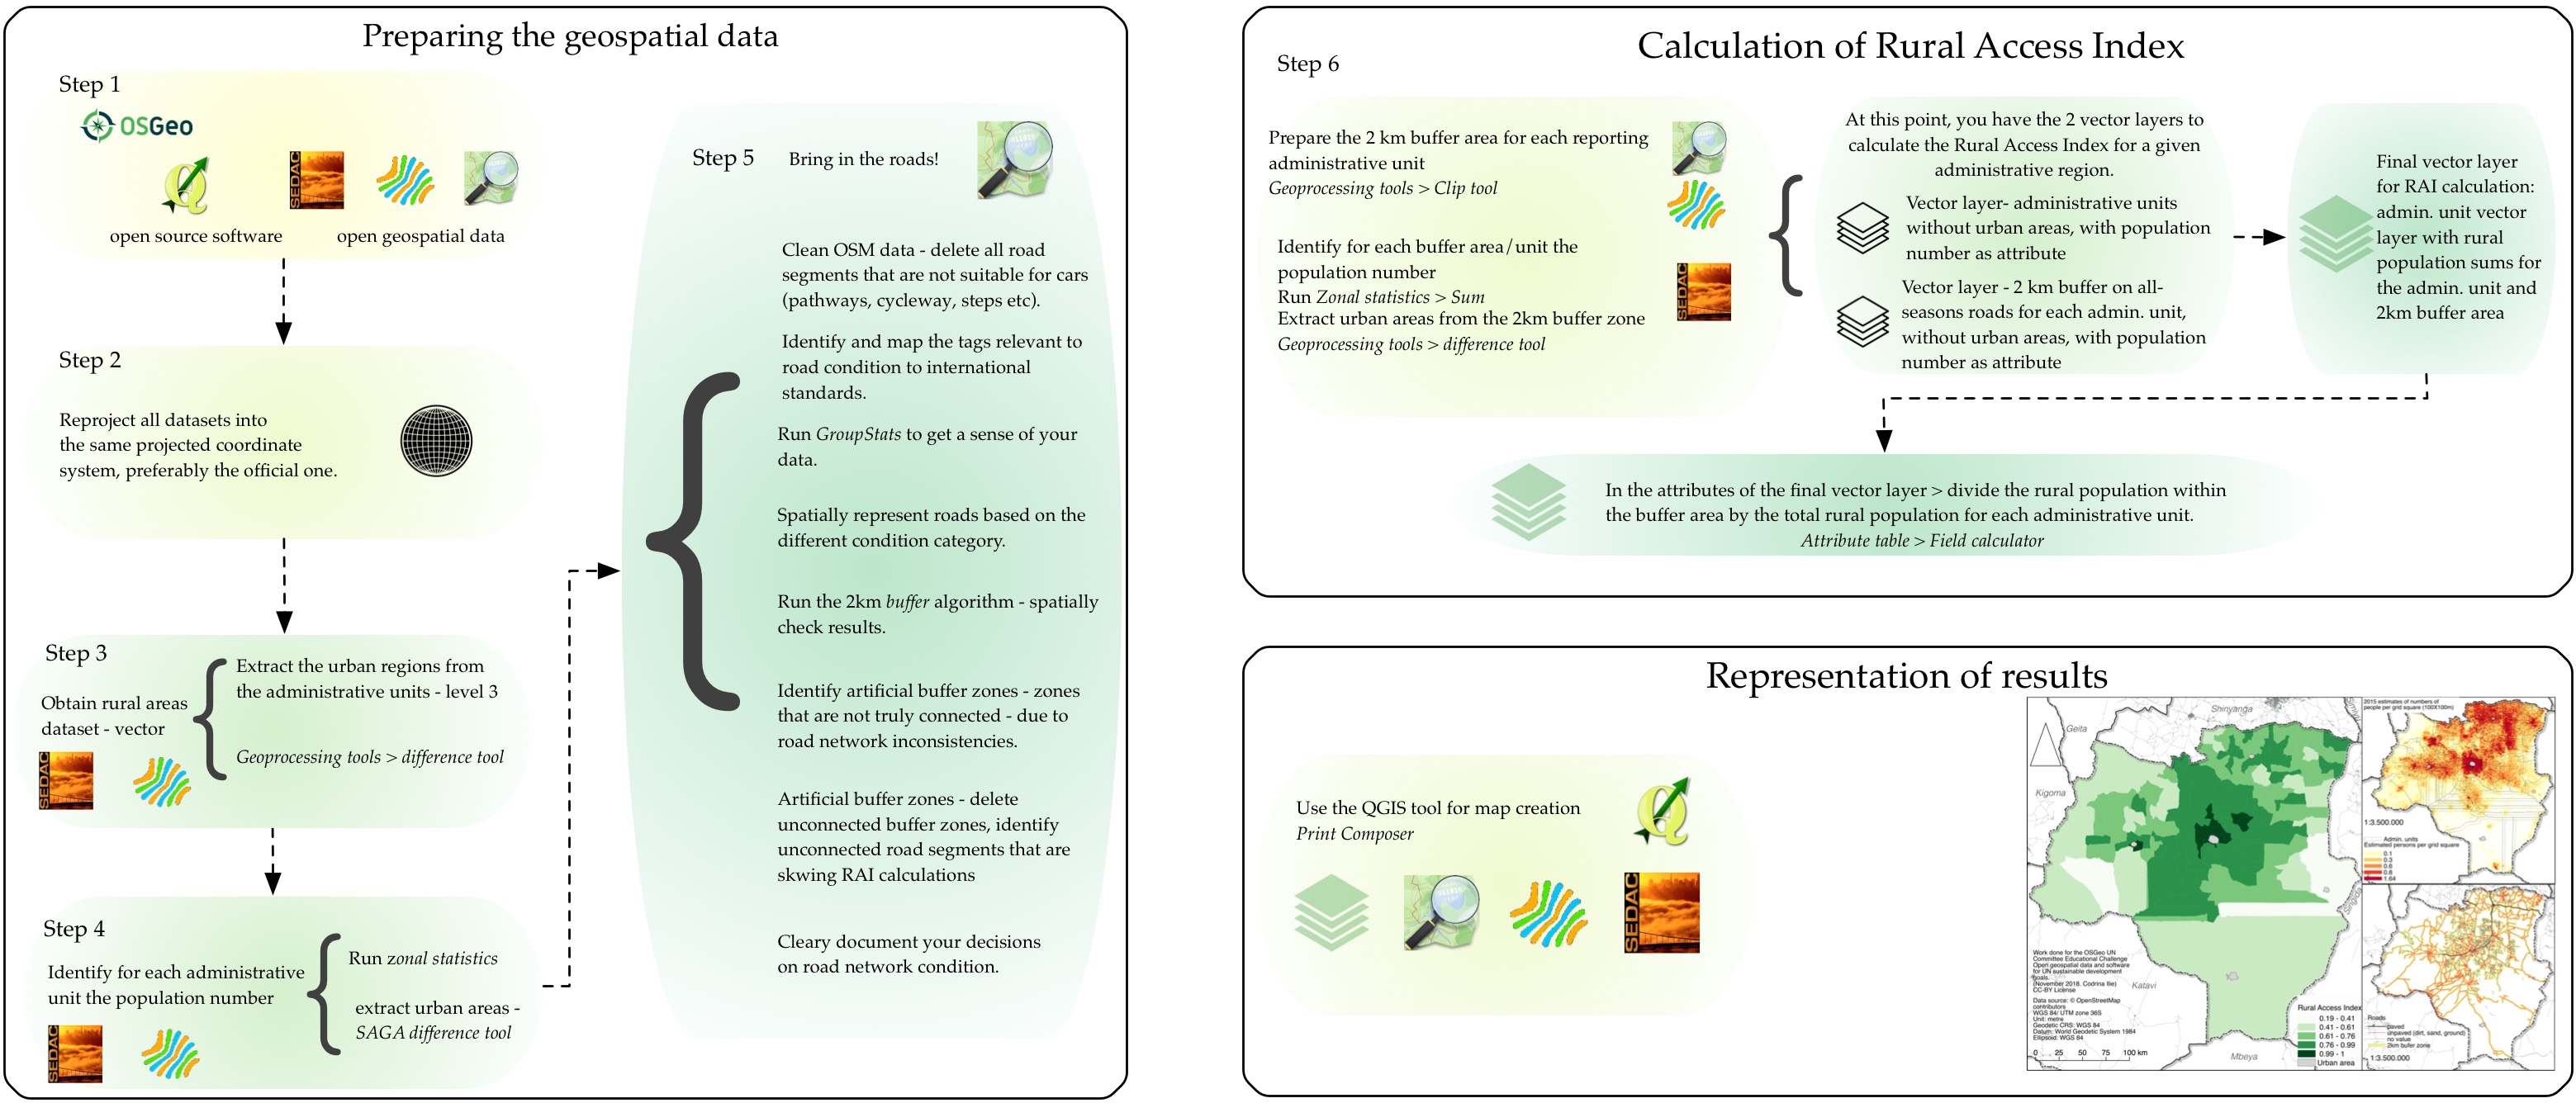
| 03:33, 21 January 2019 | Fig25 workflow.jpg (file) |  |
805 KB | Conceptual schema for the workflow to calculate the Rural Access Index using open data and open source software. | 1 |
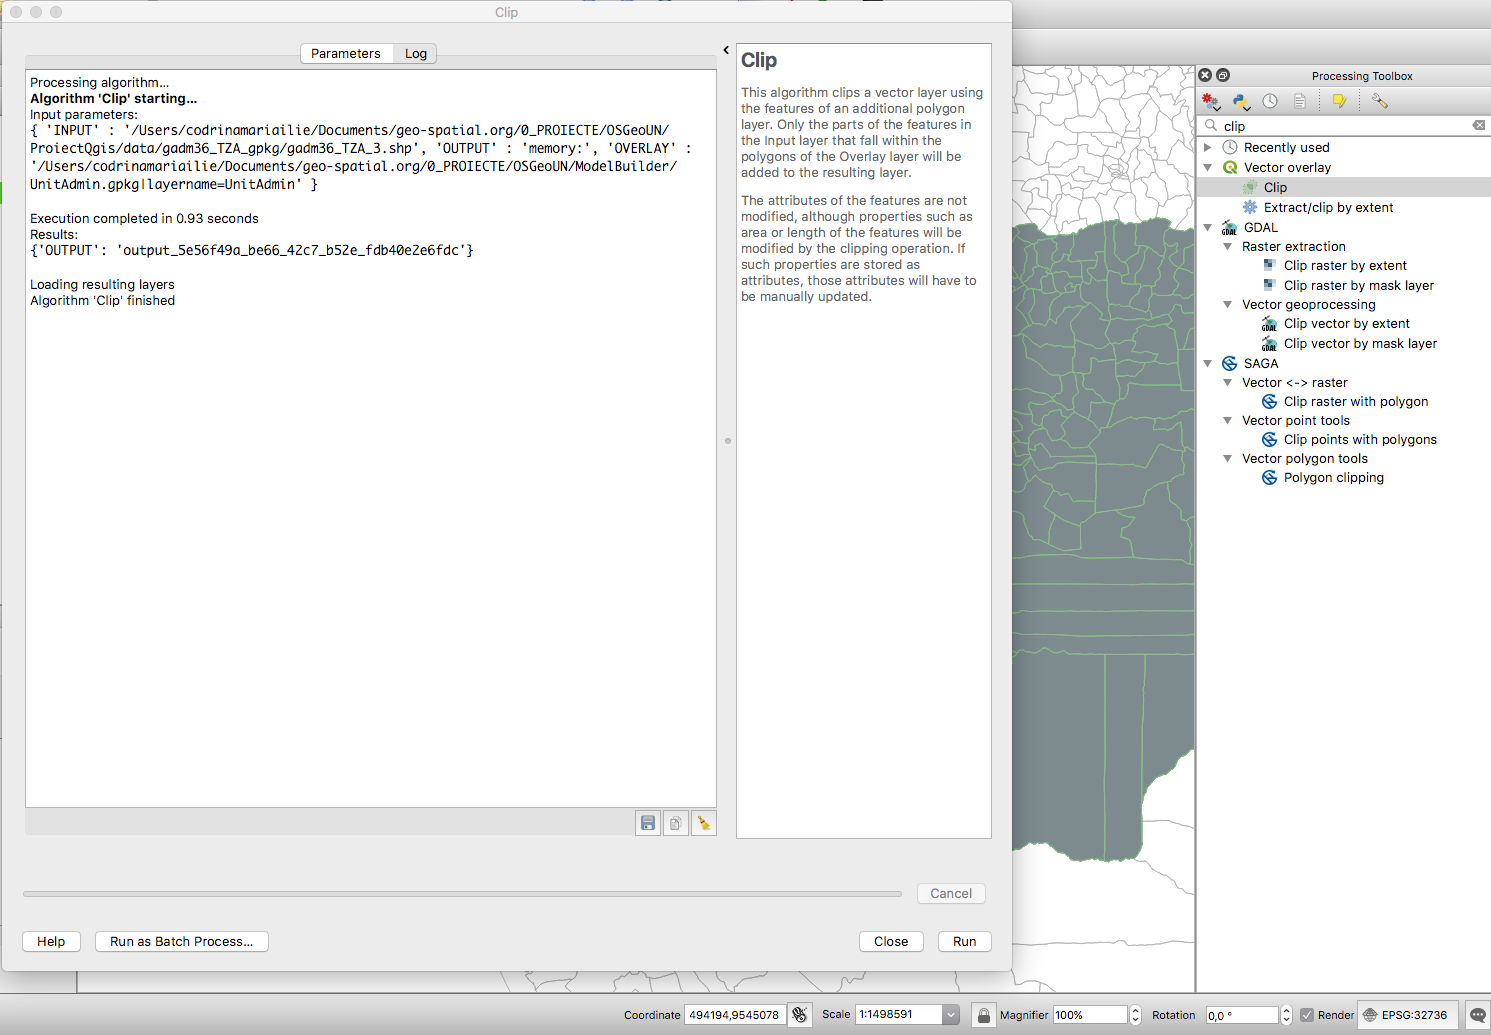
| 02:19, 21 January 2019 | Fig2 clip.png (file) |  |
303 KB | Clip tool for vector data identified in the Processing Toolbox through search functionality. | 1 |
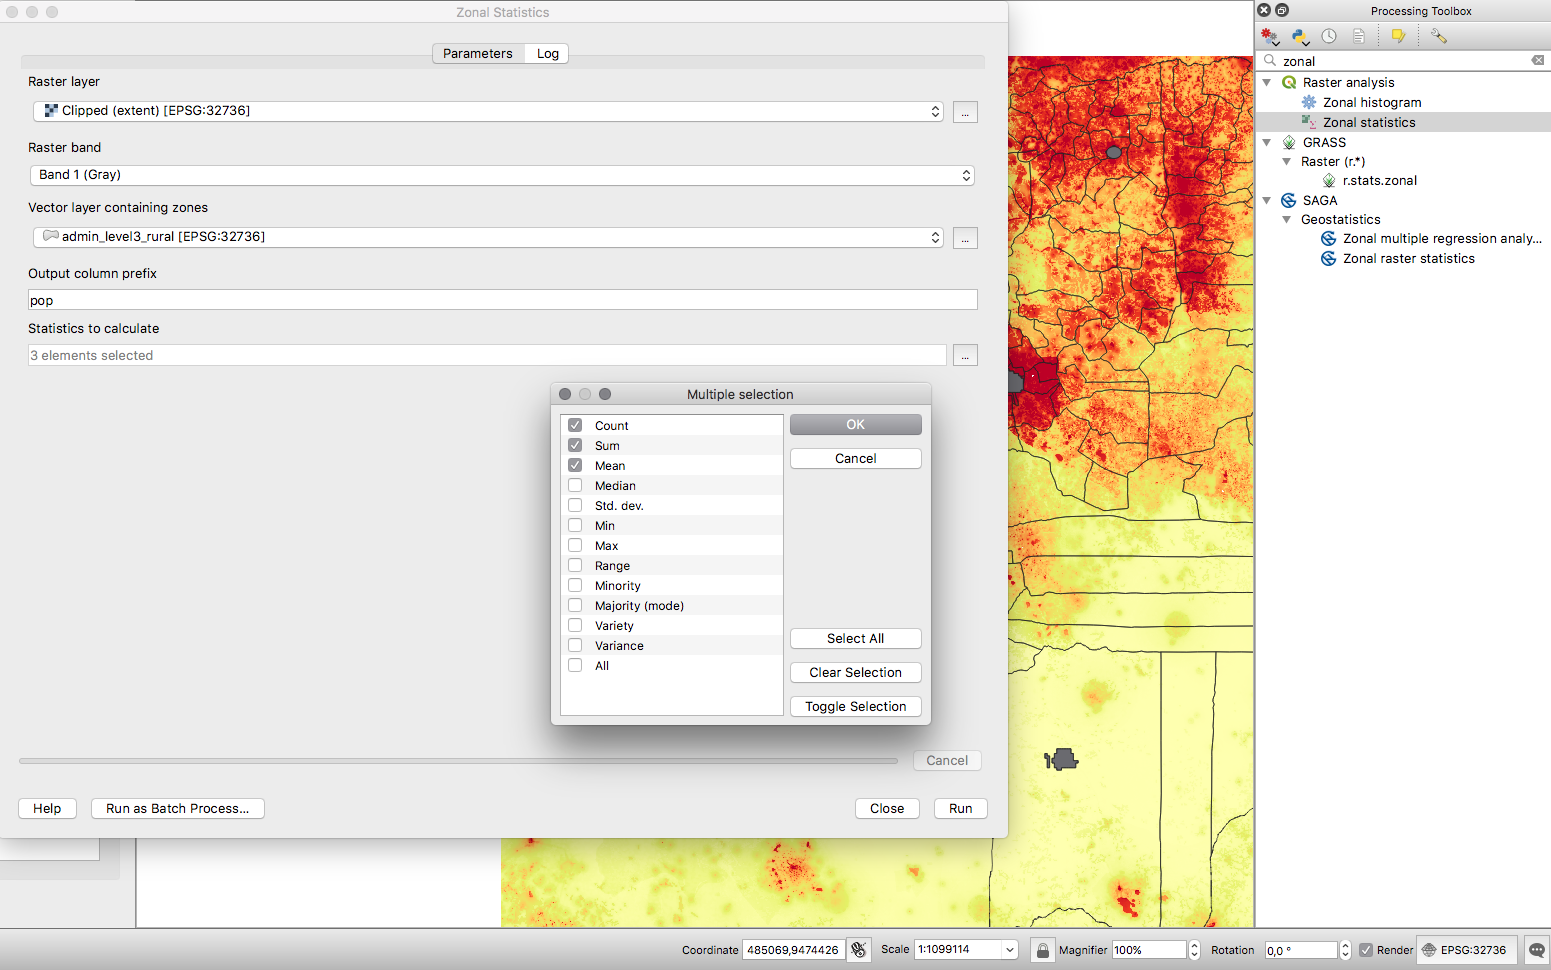
| 02:31, 21 January 2019 | Fig4 zonalStats.png (file) |  |
703 KB | Zonal statistics functionality | 1 |
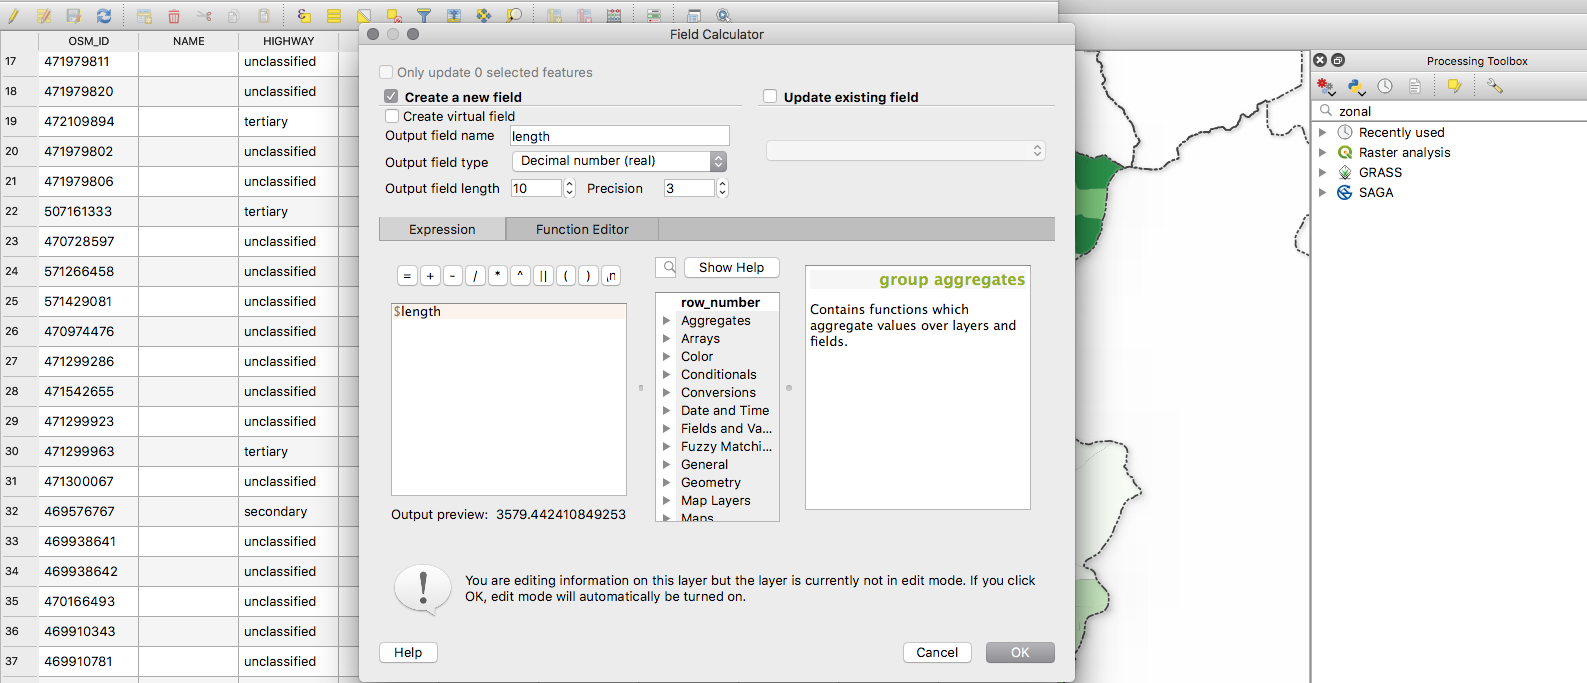
| 02:34, 21 January 2019 | Fig5 length.png (file) |  |
255 KB | Example of working with the Filed Calculator to automatically calculate lengths of segments. | 1 |
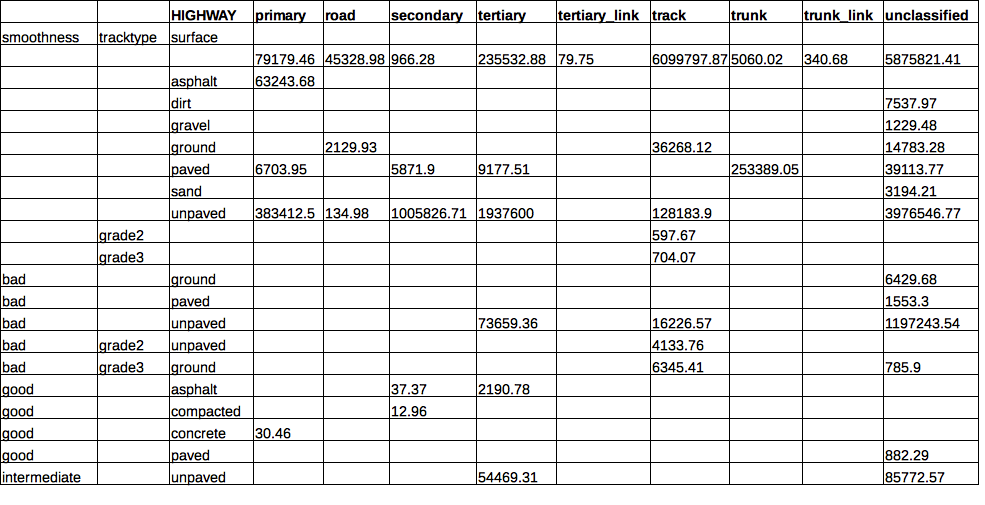
| 02:37, 21 January 2019 | Fig6 roadCondition1.png (file) |  |
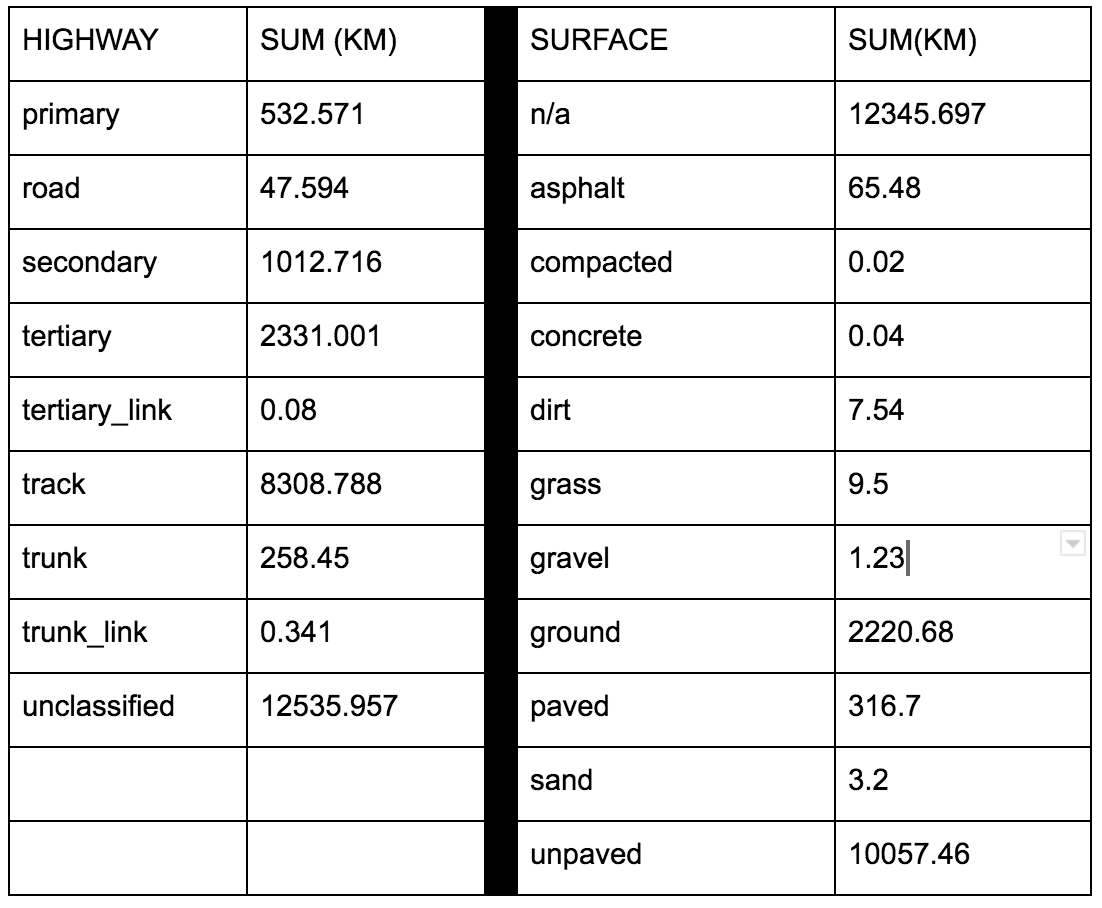
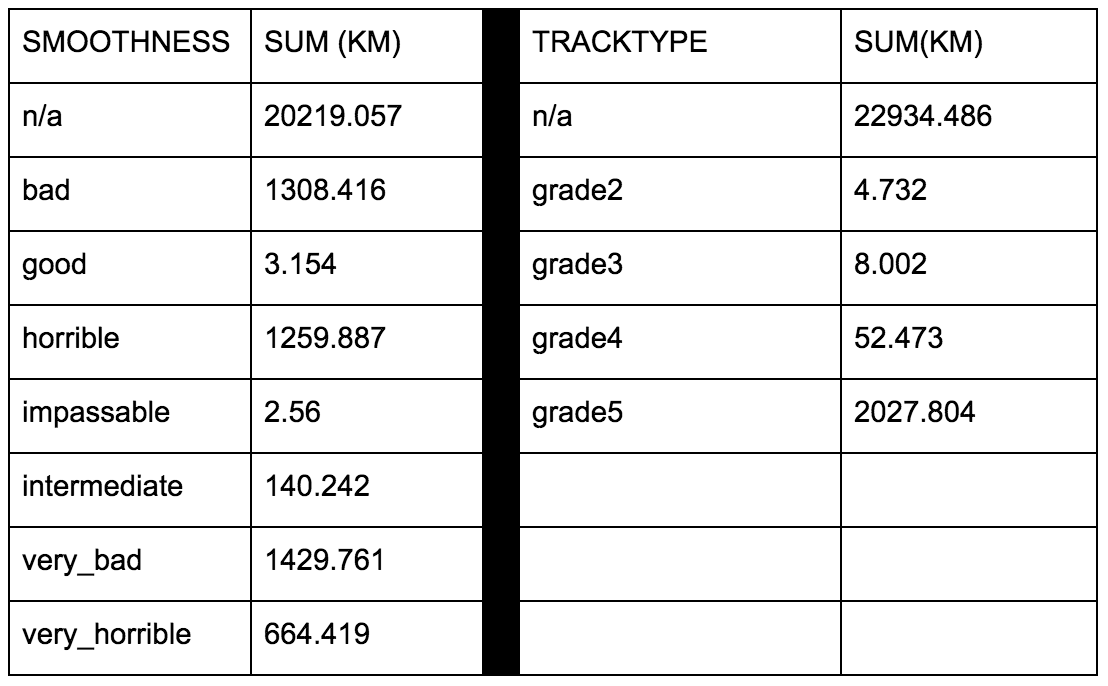
118 KB | Result of GroupStats to identify the sum (km) calculated for each surface group of the highway features. | 1 |
| 02:41, 21 January 2019 | Fig6 roadCondition2.png (file) |  |
90 KB | Results of GroupStats to identify the sum (in km) for each surface group of the highway features | 1 |
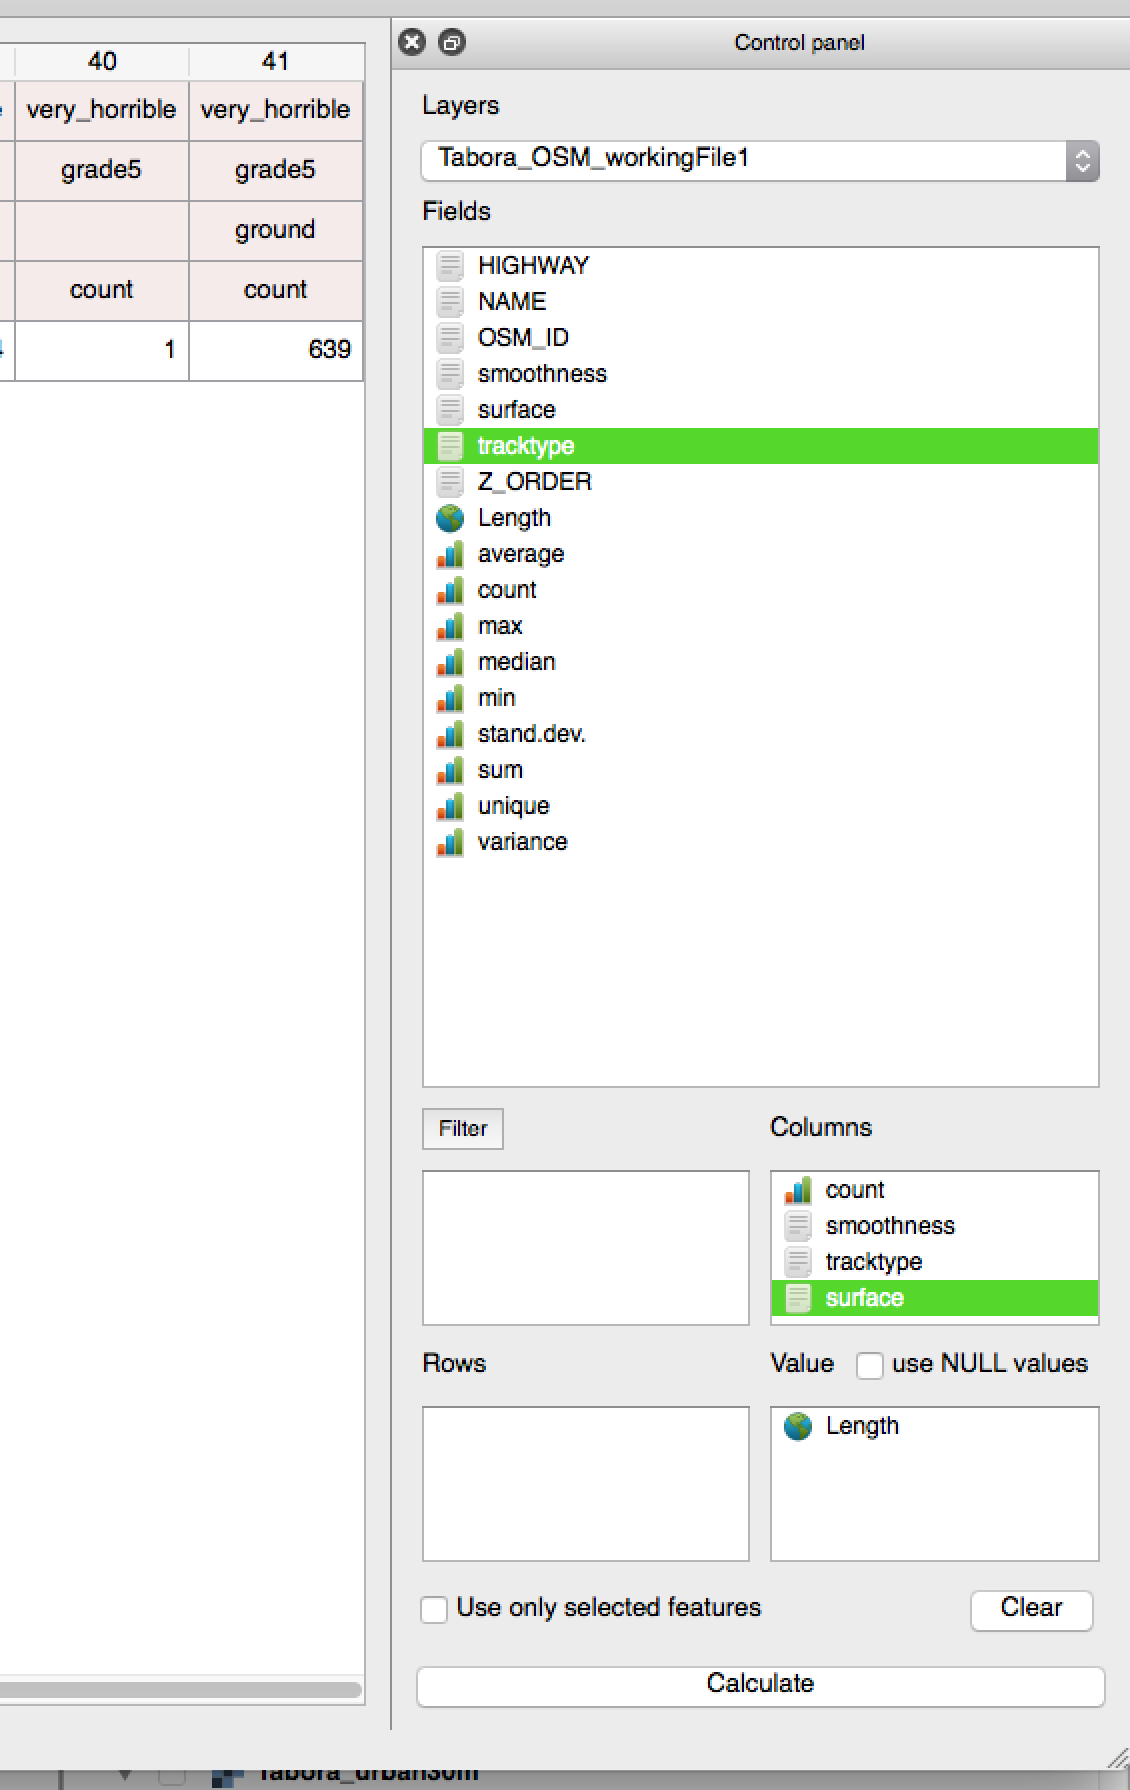
| 02:44, 21 January 2019 | Fig7 groupStats.png (file) |  |
152 KB | Example on how to use GroupStats | 1 |
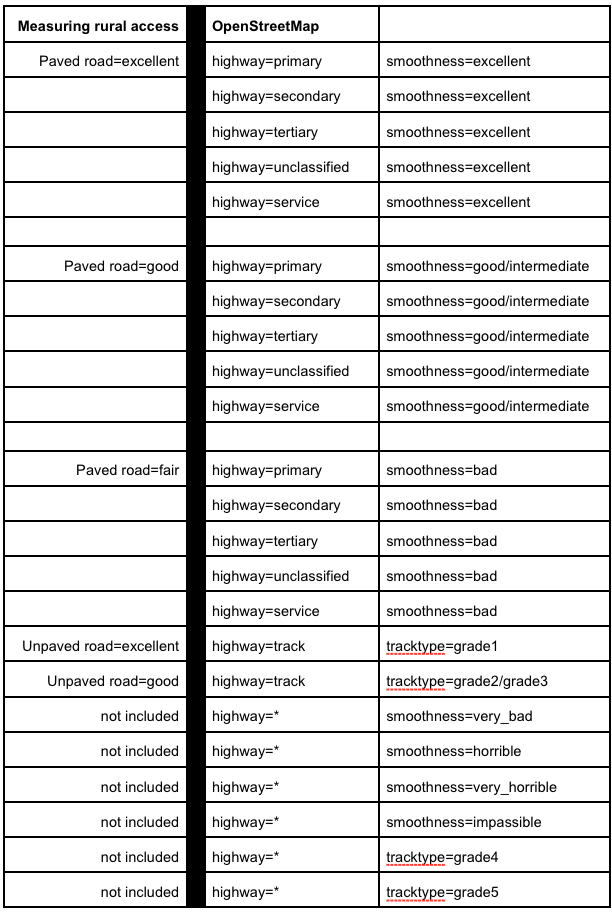
| 02:47, 21 January 2019 | Fig8 mappingTags.png (file) |  |
119 KB | The correspondence between OSM tags and international standards for road condition. | 1 |
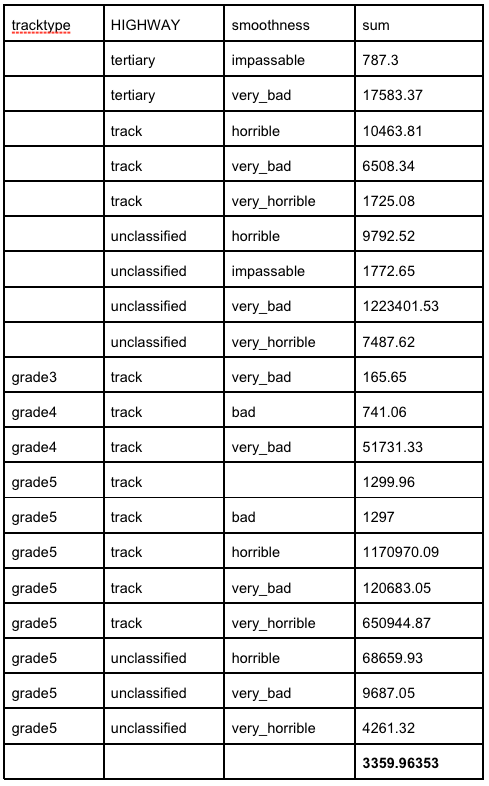
| 02:50, 21 January 2019 | Fig9 excludedRoadsbyCondition.png (file) |  |
85 KB | The results of running GroupStats to identify lengths of OSM roads tagged as in bad condition. | 1 |
| 13:38, 31 October 2022 | Mou smartgeoexpo osgeo nov 2022.pdf (file) | 335 KB | MoU between Smart GEO Expo and OSGeo signed in November 2022. | 1 |