Difference between revisions of "Training Material for 2019 UN Open GIS Challenge 2 - Open geospatial data and software for UN SDG 16, Peace justice and open institutions"
Wiki-Banbar (talk | contribs) |
m (license - including the publication) |
||
| (56 intermediate revisions by one other user not shown) | |||
| Line 6: | Line 6: | ||
We have prepared this educational material for researchers, educators and professionals in local, regional, national or international agencies with minimal geospatial information knowledge. We assume our audience has introductory knowledge of database management systems and programming. Nevertheless, the tutorial is intended to be self-contained meaning that anyone following the steps could understand and implement what had been achieved in this tutorial. | We have prepared this educational material for researchers, educators and professionals in local, regional, national or international agencies with minimal geospatial information knowledge. We assume our audience has introductory knowledge of database management systems and programming. Nevertheless, the tutorial is intended to be self-contained meaning that anyone following the steps could understand and implement what had been achieved in this tutorial. | ||
=== License === | === License === | ||
| − | + | The development of this educational material was coordinated by Berk Anbaroğlu under the mentorship of Maria Brovelli, Serena Coetzee and Timur Obukhov. In addition, İhsan Buğra Coşkun and Mohammad Almasri contributed to the development of this tutorial. We would like to thank Agit Oktay for his support regarding the development of the web interface. Last, we would like to thank Matthias Kuhn who helped us with various issues regarding QGIS and QField, and for his suggestion to use Syncthing. The material is distributed under Attribution-ShareAlike 4.0 International (CC BY-SA 4.0) license. This entitles that the users of this tutorial could share and adapt this content as long as the attribution is provided and that the same license is used upon adaptations. | |
| − | This tutorial has been kindly supported by the [https://www.osgeo.org/foundation-news/2019-osgeo-un-committee-educational-challenge/ 2019 OSGeo UN Committee Educational Challenge]. | + | This tutorial has been kindly supported by the [https://www.osgeo.org/foundation-news/2019-osgeo-un-committee-educational-challenge/ 2019 OSGeo UN Committee Educational Challenge]. |
| + | |||
| + | If you are using this tutorial for scientific research, please cite the paper: | ||
| + | |||
| + | Anbaroğlu, B., İ. B. Coşkun, M. A. Brovelli, T. Obukhov, and S. Coetzee. 2020. ‘Educational Material Development on Mobile Spatial Data Collection Using Open Source Geospatial Technologies’. Pp. 221–27 in The International Archives of the Photogrammetry, Remote Sensing and Spatial Information Sciences. Vol. XLIII-B4-2020. Copernicus GmbH. | ||
| + | |||
=== Software Used === | === Software Used === | ||
* PostgreSQL (Postgres) 11.5 is used to create the database that would store the collected data. PostGIS 2.5.3 extension is used to handle spatial data. | * PostgreSQL (Postgres) 11.5 is used to create the database that would store the collected data. PostGIS 2.5.3 extension is used to handle spatial data. | ||
| Line 18: | Line 23: | ||
=== Scenario === | === Scenario === | ||
| − | United Nations (UN) officers require mobile field data collection for various purposes, mainly of which is to provide reliable measures to the indicators of targets. It is necessary to provide an easy-to-follow tutorial that will ease the process of mobile spatial data collection of UN officers. This tutorial addresses some of the practical requirements of mobile spatial data collection including offline data collection, attaching photos to recorded events, editing of spatial features on the field and displaying the collected data on the internet through a simple scenario. There are several readily available open source mobile data collection platforms. These are compared as follows:[[File: | + | United Nations (UN) officers require mobile field data collection for various purposes, mainly of which is to provide reliable measures to the indicators of targets. It is necessary to provide an easy-to-follow tutorial that will ease the process of mobile spatial data collection of UN officers. This tutorial addresses some of the practical requirements of mobile spatial data collection including offline data collection, attaching photos to recorded events, editing of spatial features on the field and displaying the collected data on the internet through a simple scenario. There are several readily available open source mobile data collection platforms. These are compared as follows:[[File:platform_comparison.jpg|thumb|center| Overview of the tutorial]] |
This paper relied on ''QField'' due to its ease of use and smooth integration with QGIS either by using the QField Sync plugin or its | This paper relied on ''QField'' due to its ease of use and smooth integration with QGIS either by using the QField Sync plugin or its | ||
| Line 30: | Line 35: | ||
The scenario utilised in this tutorial is recording the location and thematic information of trees in a region. Specifically, a lecturer identifies polygons in which each student is responsible for. Thereon, students go to the field to collect the information regarding trees in that region. | The scenario utilised in this tutorial is recording the location and thematic information of trees in a region. Specifically, a lecturer identifies polygons in which each student is responsible for. Thereon, students go to the field to collect the information regarding trees in that region. | ||
| + | |||
| + | ''The code of the tutorial can be accessed from this [https://github.com/banbar/OSGeo-Challenge2-2019/ GitHub repo].'' | ||
===Acquired Knowledge=== | ===Acquired Knowledge=== | ||
| Line 45: | Line 52: | ||
A database server should be available in the web to initiate a mobile geographic data collection project. There are several solutions that offer a free solution to this. One of the platforms supporting Postgres and PostGIS is Heroku, which is a platform as a service (PaaS) that enables developers to build, run, and operate applications entirely in the cloud. Therefore, this tutorial relied on Heroku to set up the database on the cloud. | A database server should be available in the web to initiate a mobile geographic data collection project. There are several solutions that offer a free solution to this. One of the platforms supporting Postgres and PostGIS is Heroku, which is a platform as a service (PaaS) that enables developers to build, run, and operate applications entirely in the cloud. Therefore, this tutorial relied on Heroku to set up the database on the cloud. | ||
| − | The sign up page of [https://signup.heroku.com/login?redirect-url=https%3A%2F%2Fid.heroku.com%2Foauth%2Fauthorize%3Fclient_id%3Dd2ef2b24-e72c-4adf-8506-28db2218547d%26response_type%3Dcode%26scope%3Dglobal%252Cplatform%26state%3DSFMyNTY.g3QAAAACZAAEZGF0YW0AAAAxaHR0cHM6Ly9kYXNoYm9hcmQuaGVyb2t1LmNvbS9hdXRoL2hlcm9rdS9jYWxsYmFja2QABnNpZ25lZG4GANL7onluAQ.eDiBIjGpk8wBx82K2Ej2tBwAitNPBGNQoMMDLoySy78 Heroku] | + | The sign up page of [https://signup.heroku.com/login?redirect-url=https%3A%2F%2Fid.heroku.com%2Foauth%2Fauthorize%3Fclient_id%3Dd2ef2b24-e72c-4adf-8506-28db2218547d%26response_type%3Dcode%26scope%3Dglobal%252Cplatform%26state%3DSFMyNTY.g3QAAAACZAAEZGF0YW0AAAAxaHR0cHM6Ly9kYXNoYm9hcmQuaGVyb2t1LmNvbS9hdXRoL2hlcm9rdS9jYWxsYmFja2QABnNpZ25lZG4GANL7onluAQ.eDiBIjGpk8wBx82K2Ej2tBwAitNPBGNQoMMDLoySy78 Heroku] requires some personal information such as name, surname and email address. |
| − | [[File:1_Heroku_Login.jpg|thumb|center| | + | [[File:1_Heroku_Login.jpg|thumb|center|Sign up page of Heroku]] |
Once the form is submitted, an email is sent to verify the account. These credentials is used to create a new app. | Once the form is submitted, an email is sent to verify the account. These credentials is used to create a new app. | ||
| Line 78: | Line 85: | ||
#* Username: User | #* Username: User | ||
#* Password: Password (check the ‘Save password’ box for ease of login in future) | #* Password: Password (check the ‘Save password’ box for ease of login in future) | ||
| − | # Finally go the '''Advanced''' tab and state the name of the database | + | # Finally go the '''Advanced''' tab and state the name of the database next to '''DB restriction''', so that only the relevant database would be visible on your screen. |
[[File:heroku_connection.png|thumb|center| Connecting Heroku database]] | [[File:heroku_connection.png|thumb|center| Connecting Heroku database]] | ||
| Line 111: | Line 118: | ||
Once PostGIS is right-clicked, and '''New Connection''' is clicked, the following interface opens in which you can provide database credentials of the Heroku database. | Once PostGIS is right-clicked, and '''New Connection''' is clicked, the following interface opens in which you can provide database credentials of the Heroku database. | ||
[[File:postgres2qgis.jpg|thumb|center|Linking the Postgres database with QGIS]] | [[File:postgres2qgis.jpg|thumb|center|Linking the Postgres database with QGIS]] | ||
| − | + | ||
| + | Details you have to provide: | ||
| + | * An arbitrary '''Name''' | ||
| + | * '''Host''', '''Port''' and '''Database''' should exactly be the same as it appears on the Heroku page. | ||
| + | * '''SSL mode''' should be ''allow''. | ||
| + | * Go to '''Basic''' tab under '''Authentication''', and you store the '''user name''' and '''password''' in order to ease the process of real time data collection. | ||
| + | * Do not forget to check the box '''Also list tables with no geometry''' to obtain all the tables of the database. | ||
If all the credentials of the Heroku database are entered correctly, clicking the '''Test Connection''' button pops up a window indicating the success of the connection. | If all the credentials of the Heroku database are entered correctly, clicking the '''Test Connection''' button pops up a window indicating the success of the connection. | ||
| Line 126: | Line 139: | ||
* '''Widget type''': Value Relation | * '''Widget type''': Value Relation | ||
* '''Layer''': trees_type | * '''Layer''': trees_type | ||
| − | * '''Key column''': | + | * '''Key column''': name_en |
* '''Value column''': name_en | * '''Value column''': name_en | ||
In addition, some of the attributes might better be hidden from the users such as the ''id'' attribute of the trees or regions as it is a serial number that auto increments as a tree/region is recorded. Therefore, this attribute shall ''not'' be editable. In addition, it can be ''hidden'' from the user to reduce clutter in the GUI of the QField. This process is illustrated as follows. | In addition, some of the attributes might better be hidden from the users such as the ''id'' attribute of the trees or regions as it is a serial number that auto increments as a tree/region is recorded. Therefore, this attribute shall ''not'' be editable. In addition, it can be ''hidden'' from the user to reduce clutter in the GUI of the QField. This process is illustrated as follows. | ||
| Line 158: | Line 171: | ||
Once the QGS project file is transferred to the mobile device, it can be opened using QField as shown in (a). The layers appear just like they do in QGIS,as shown in (b). In order to start editing, the relevant layer is selected and then the pen icon is toggled in the upper-right corner of the screen. Once the horizontal lines button on the upper left corner is pressed, the user can start collecting data. The location could either be set by panning around the map and clicking on the '+' button located at the bottom-right of the screen or by clicking the locate button at the left-hand side of the screen, which uses the GNSS receiver of the phone to locate the position of the user. New features are added just like they are added in QGIS with the functionality of hiding some attributes (e.g. id in trees) or by offering a drop-down list to the user (e.g. user can select one of the pre-defined tree types). | Once the QGS project file is transferred to the mobile device, it can be opened using QField as shown in (a). The layers appear just like they do in QGIS,as shown in (b). In order to start editing, the relevant layer is selected and then the pen icon is toggled in the upper-right corner of the screen. Once the horizontal lines button on the upper left corner is pressed, the user can start collecting data. The location could either be set by panning around the map and clicking on the '+' button located at the bottom-right of the screen or by clicking the locate button at the left-hand side of the screen, which uses the GNSS receiver of the phone to locate the position of the user. New features are added just like they are added in QGIS with the functionality of hiding some attributes (e.g. id in trees) or by offering a drop-down list to the user (e.g. user can select one of the pre-defined tree types). | ||
| − | |||
| − | |||
| − | |||
| − | |||
| − | |||
| − | |||
| − | |||
| − | |||
| − | |||
| − | |||
| − | |||
| − | |||
| − | |||
| − | |||
| − | |||
| − | |||
| − | |||
| − | |||
| − | |||
| − | |||
| − | |||
| − | |||
| − | |||
==Collecting Photos in the Field== | ==Collecting Photos in the Field== | ||
| Line 196: | Line 186: | ||
[[File:syncthing_showid.jpg|thumb|center| Obtaining the ID of the PC where each photo will be uploaded]] | [[File:syncthing_showid.jpg|thumb|center| Obtaining the ID of the PC where each photo will be uploaded]] | ||
| − | The ID of a device is presented as a text and QR code as shown | + | The ID of a device is presented as a text and QR code as shown below. |
[[File:syncthing_id.jpg|thumb|center| ID of a Snycthing device]] | [[File:syncthing_id.jpg|thumb|center| ID of a Snycthing device]] | ||
| Line 221: | Line 211: | ||
Having reached this step means that the mobile device and PC are synchronised. One may add further mobile devices with the same procedure. Once the connection is established between the devices, the details regarding file synchronization must be provided. | Having reached this step means that the mobile device and PC are synchronised. One may add further mobile devices with the same procedure. Once the connection is established between the devices, the details regarding file synchronization must be provided. | ||
| − | |||
| − | |||
===Updating the QGIS Project=== | ===Updating the QGIS Project=== | ||
| Line 246: | Line 234: | ||
# Select '''Widget Type''' as '''Attachment''' | # Select '''Widget Type''' as '''Attachment''' | ||
# Enter default path of DCIM folder | # Enter default path of DCIM folder | ||
| − | # Select 'Relative paths' | + | # Select '''Relative paths''' and leave the default option checked '''Relative to Project Path''' |
[[File:photo_config_1.jpg|thumb|center|Configuring the photos field – part 1 ]] | [[File:photo_config_1.jpg|thumb|center|Configuring the photos field – part 1 ]] | ||
| Line 254: | Line 242: | ||
# Check '''Display Resource Path''' | # Check '''Display Resource Path''' | ||
# Check '''Display button to open file dialog''' | # Check '''Display button to open file dialog''' | ||
| + | # Finally, select the '''Integrated Document Viewer''' as '''Image''' | ||
| + | |||
| + | Press the apply button. The project is now ready to display photos of trees. | ||
[[File:photo_config_2.jpg|thumb|center|Configuring the photos field – part 2 ]] | [[File:photo_config_2.jpg|thumb|center|Configuring the photos field – part 2 ]] | ||
| − | |||
| − | |||
| − | + | '''Transfer''' the project folder containing: | |
| + | * the updated QGS file (osgeo_challenge2_2019_w_photo.qgs) and | ||
| + | * the DCIM folder that you will now share | ||
| + | to your mobile device. | ||
| − | To synchronise | + | [[File:project_folder.jpg|thumb|center|Transfer the project folder to the mobile device]] |
| + | |||
| + | To synchronise the photo folder with the connected devices, press '''Add Folder''' in the SyncTrayzor as shown below. | ||
[[File:photo_synctrayzor.jpg|thumb|center|Adding the folder in SyncTrayzor for sharing photos with multiple users]] | [[File:photo_synctrayzor.jpg|thumb|center|Adding the folder in SyncTrayzor for sharing photos with multiple users]] | ||
| − | Enter the folder name and folder path. It is important to enter the file location correctly as shown below | + | Enter the folder name and folder path. It is important to enter the file location correctly as shown below. |
[[File:photo_synctrayzor_setup.jpg|thumb|center|Setting the file synchronisation folder]] | [[File:photo_synctrayzor_setup.jpg|thumb|center|Setting the file synchronisation folder]] | ||
| Line 274: | Line 268: | ||
[[File:photo_devices2share.jpg|thumb|center|Selecting the devices to share the directory containing photos]] | [[File:photo_devices2share.jpg|thumb|center|Selecting the devices to share the directory containing photos]] | ||
| − | This sends a request to the mobile device(s) selected for acknowledgment. | + | This sends a request to the mobile device(s) selected for acknowledgment. Please note that |
| + | * this request appears '''only''' in the pull-down notification bar as shown below and | ||
| + | * it might take a while since mobile devices can easily get disconnected. | ||
| − | [[File: | + | [[File:drop_down.jpg|thumb|center|Folder share request sent to mobile device]] |
| − | + | [[File:photo_ackw_mobile.jpg|thumb|center|Accept the request]] | |
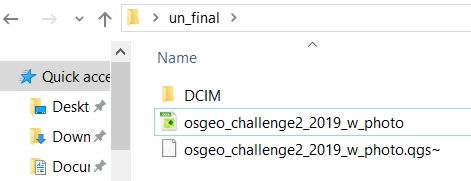
| − | [[File:photo_mobile_setup. | + | '''Select''' the DCIM folder that you previously transferred to finalise the synchronisation setup on your mobile device as shown below. Note that it is the same folder that you transferred to the mobile device (i.e. '''DCIM''' folder under the '''un_final''' folder). |
| + | |||
| + | [[File:photo_mobile_setup.jpeg|thumb|center|Setting up the mobile device to accommodate synched photos]] | ||
Now the synched mobile devices are ready to take photos. The photos will be synched with the PC as well as with other synched mobile devices. | Now the synched mobile devices are ready to take photos. The photos will be synched with the PC as well as with other synched mobile devices. | ||
| + | |||
| + | ===Collecting Photos on the Field=== | ||
| + | |||
| + | Open the updated QGIS project file (osgeo_challenge2_2019_w_photo.qgs) in QField and record an observation. The following screen will pop-up: | ||
| + | |||
| + | [[File:photo_take_qfield.jpeg|thumb|center|Taking a photo of an observation with QField]] | ||
| + | |||
| + | Once the camera icon is clicked, camera opens an a photo can be captured. If there is a problem at this point, make sure that the '''Use native camera function''' is turned off under QField Settings as shown below: | ||
| + | |||
| + | [[File:photo_native_camera.jpeg|thumb|center|Taking a photo of an observation with QField]] | ||
| + | |||
| + | The captured photos will be synched with all the connected devices. Consequently, a captured photo of a tree can also be visualised in QGIS: | ||
| + | |||
| + | [[File:photo_on_qgis.jpg|thumb|center|Visualising a Field Photo in QGIS]] | ||
| + | |||
| + | |||
| + | ==Offline Data Collection== | ||
| + | |||
| + | QField allows its users to collect data when there is no internet connection. This requires the use of the [https://plugins.qgis.org/plugins/qfieldsync/ '''QField Snyc'''] plugin, which can be installed from the QGIS plugin repository. | ||
| + | |||
| + | The overall process of offline data collection is illustrated below: | ||
| + | |||
| + | [[File:offline_process.jpg|thumb|center|Offline data collection]] | ||
| + | |||
| + | First, is setting up the environment. We need to export the QGIS project using the QFieldSync plugin, and update the QGS project file as this process might change some of the existing settings. Thereon, we need to rely on Syncyhing if photos are going to be collected in the field, or otherwise we can start collecting field data. Once we have internet connection again,the folder would be transferred to PC and QFieldSync will be used to synchronise the project. | ||
| + | |||
| + | ===Export Project=== | ||
| + | |||
| + | The first part is to export the project so that all the database is backed up to a Geopackage file (gpkg) that QField can update. | ||
| + | |||
| + | The required steps are as follows: | ||
| + | * Under '''Plugins''' → '''QFieldSync''', select '''Preferences''' as shown in (a) below. Clicking on this button opens the window presented in (b). | ||
| + | ** Set the '''Default Import Directory''' to be the path of the project. | ||
| + | ** Set the '''Default Export Directory''' to be the path of the files that are to be exported. This directory must be copied to the mobile device. | ||
| + | |||
| + | [[File:qfield_sync_plugin.jpg|thumb|center|QFieldSnyc plugin]] | ||
| + | |||
| + | * Select '''Project Configuration''', which opens a window as shown below listing the available layers and actions that can to be taken for each of them. | ||
| + | ** For OpenStreetMap, select '''no action'''. | ||
| + | ** The other layers should be in the '''offline editing''' mode. | ||
| + | |||
| + | [[File:qfield_sync_details.jpg|thumb|center|QField project synchronisation details]] | ||
| + | |||
| + | * Select '''Package for QField''', which opens the following window. Select the export directory, which can be the same directory as previously. Once the '''Create''' button is clicked, the plugin creates the required Geopackage file and associates it with the QGS file. In this way, data are stored in a Geopackage file. | ||
| + | |||
| + | [[File:qfield_geopackage.jpg|thumb|center|Creating the package for QField]] | ||
| + | |||
| + | '''Note''' that once the export folder is successfully created as shown below, it '''may''' disrupt the project file. For example, the drop down list to select the tree type, which otherwise works when the QGS file is transferred directly to QField, does not work any more. | ||
| + | |||
| + | Open the new project file in QGIS and '''make sure''' that all of the settings are correct. | ||
| + | |||
| + | Finally, open a '''DCIM''' folder, which will be used to synchronise photos that are captured offline. | ||
| + | |||
| + | [[File:export_folder.jpg|thumb|center|Make sure settings are correct in the exported QGIS file]] | ||
| + | |||
| + | ===Capturing Photos in the Field=== | ||
| + | |||
| + | Continue with the following steps while you have internet connection: | ||
| + | * Transfer the project to the mobile devices. Multiple users can collect offline data. | ||
| + | * Open SyncTrayzor (PC) and share the '''DCIM''' folder with other devices. | ||
| + | * Syncthing will ask you to accept the request on your mobile device. Accept it and select the '''DCIM''' under the '''export''' folder. In this way, all the photos captured in QField will be stored under the DCIM folder, which would then be synchronised. | ||
| + | |||
| + | ===Data Collection=== | ||
| + | |||
| + | At this stage, we do not have internet connection any more. Nevertheless, we can collect field data with the following steps: | ||
| + | * Open the project available under the '''export''' directory in QField. | ||
| + | * Collect field data. | ||
| + | * You can also '''update''' existing records, such as changing the height of an existing tree. | ||
| + | |||
| + | Now we are ready to synchronise data we have just collected. For this, we need to have internet connection. | ||
| + | |||
| + | ===Synchronisation=== | ||
| + | Once you have internet connection again, do the followings to synchronise: | ||
| + | * Transfer the '''export''' folder in your mobile device back to your PC. | ||
| + | * Open GIS. | ||
| + | * Under '''QFieldSync''' plugin select '''Synchronize from QField''', which opens up a window as illustrated below. | ||
| + | * Once the '''Synchronize''' button is clicked, '''all''' of the content of the Geopackage is read and the Heroku database is updated accordingly. | ||
| + | [[File:sync_back.jpg|thumb|center|Synchronize project]] | ||
| + | * Save the QGS file. | ||
| + | * You can repeat the process of synchronising for other devices by repeating this last process. | ||
==Web Interface== | ==Web Interface== | ||
| Line 301: | Line 379: | ||
Git is a software development version control system. In order to effectively upload our project to GitHub, Git must be downloaded from [https://git-scm.com/downloads/ this link]. | Git is a software development version control system. In order to effectively upload our project to GitHub, Git must be downloaded from [https://git-scm.com/downloads/ this link]. | ||
| − | ===Create App | + | ===Create Desktop App=== |
| − | + | Create an empty folder on the computer. | |
| − | |||
| − | |||
| − | |||
| − | |||
| − | |||
| − | |||
| − | |||
| − | |||
| − | |||
Open Visual Studio Code. Go to '''File''' → '''Open folder'''. | Open Visual Studio Code. Go to '''File''' → '''Open folder'''. | ||
| Line 355: | Line 424: | ||
Project settings are ready. | Project settings are ready. | ||
| − | Now, we need to | + | Now, we need to establish the database connection. Click the '''New File''' button, and add '''appConfig.js''' file. |
[[File:web_appconfig.jpg|thumb|center|Adding the appConfig.js file]] | [[File:web_appconfig.jpg|thumb|center|Adding the appConfig.js file]] | ||
| Line 379: | Line 448: | ||
parseConnectionString(process.env.DATABASE_URL); | parseConnectionString(process.env.DATABASE_URL); | ||
} else { | } else { | ||
| − | console.log("process.env.DATABASE_URL empty, | + | console.log("process.env.DATABASE_URL empty, connectionStringvariable used"); |
| − | |||
developmentDatabase = parseConnectionString(connectionString); | developmentDatabase = parseConnectionString(connectionString); | ||
} | } | ||
| Line 451: | Line 519: | ||
</nowiki> | </nowiki> | ||
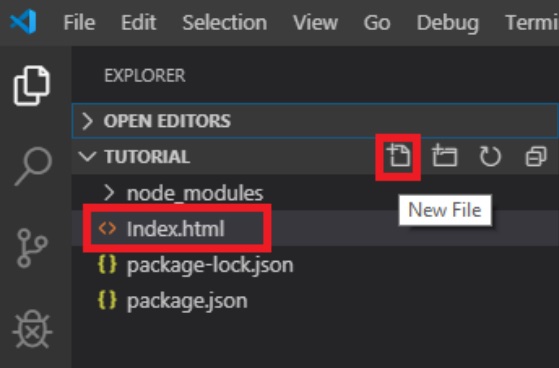
| − | Finally, the web site can be created. Press '''New File''' and create the ''' | + | Finally, the web site can be created. Press '''New File''' and create the '''index.html''' file. |
[[File:web_index_html.jpg|thumb|center|Create new file: '''index.html''']] | [[File:web_index_html.jpg|thumb|center|Create new file: '''index.html''']] | ||
| Line 459: | Line 527: | ||
<html lang="en"> | <html lang="en"> | ||
<head> | <head> | ||
| − | <meta http-equiv="Content-Security-Policy" content="upgrade-insecure- | + | <meta http-equiv="Content-Security-Policy" content="upgrade-insecure-requests"> |
| − | requests"> | + | <meta charset="utf-8"/> |
| − | <meta charset="utf-8"/> | ||
</head> | </head> | ||
<body> | <body> | ||
| − | <div id="mapdiv"></div> | + | <div id="mapdiv"></div> |
| − | <script src="http://www.openlayers.org/api/OpenLayers.js"></script> | + | <script src="http://www.openlayers.org/api/OpenLayers.js"></script> |
| − | <script src="http://code.jquery.com/jquery-2.1.1.min.js"></script> | + | <script src="http://code.jquery.com/jquery-2.1.1.min.js"></script> |
| − | <script> | + | <script> |
| − | $.getJSON('/api/data', function(data) { | + | |
| − | console.log(data[0].longitude); | + | $.getJSON('/api/data', function(data) { |
| − | console.log(data[0].latitude); | + | console.log(data[0].longitude); |
| − | var veri1=data[0].longitude; | + | console.log(data[0].latitude); |
| − | var veri2=data[0].latitude; | + | var veri1=data[0].longitude; |
| − | map = new OpenLayers.Map("mapdiv"); | + | var veri2=data[0].latitude; |
| − | map.addLayer(new OpenLayers.Layer.OSM()); | + | |
| − | var point; | + | map = new OpenLayers.Map("mapdiv"); |
| − | var length=data.length; | + | map.addLayer(new OpenLayers.Layer.OSM()); |
| − | // | + | |
| − | for (point = 0; point < data.length; point++) { | + | var point; |
| − | var lon=data[point].longitude; | + | var length=data.length; |
| − | var lat=data[point].latitude; | + | //TODO - data haritaya ekleme işlemi |
| − | + | for (point = 0; point < data.length; point++) { | |
| − | var lonLat = new OpenLayers.LonLat(lon,lat ).transform(new | + | var lon=data[point].longitude; |
| − | OpenLayers.Projection("EPSG:4326"), | + | var lat=data[point].latitude; |
| − | map.getProjectionObject()) | + | |
| − | var zoom=15; | + | var lonLat = new OpenLayers.LonLat(lon,lat ).transform(new OpenLayers.Projection("EPSG:4326"), // transform from WGS 1984 |
| − | var markers = new OpenLayers.Layer.Markers( "Markers" ); | + | map.getProjectionObject() // to Spherical Mercator Projection |
| − | map.addLayer(markers) | + | ) |
| − | markers.addMarker(new OpenLayers.Marker(lonLat)) | + | var zoom=15; |
| − | map.setCenter (lonLat, zoom) | + | |
| − | } | + | var markers = new OpenLayers.Layer.Markers( "Markers" ); |
| − | }); | + | map.addLayer(markers) |
| − | </script> | + | |
| − | </body> | + | markers.addMarker(new OpenLayers.Marker(lonLat)) |
| − | </html> | + | |
| + | map.setCenter (lonLat, zoom) | ||
| + | } | ||
| + | }); | ||
| + | </script> | ||
| + | </body> | ||
| + | </html> | ||
</nowiki> | </nowiki> | ||
| Line 561: | Line 634: | ||
[[File:web_create_repo.jpg|thumb|center|Creating a repo]] | [[File:web_create_repo.jpg|thumb|center|Creating a repo]] | ||
| − | Go to your | + | Go to your project's directory through '''cmd (Command Prompt)'''. Write the command: |
git init | git init | ||
Git is initialized in the folder. Then write this command to add all the contents of the folder: | Git is initialized in the folder. Then write this command to add all the contents of the folder: | ||
| Line 573: | Line 646: | ||
Now we need to push the project files to GitHub. Write this code: | Now we need to push the project files to GitHub. Write this code: | ||
git push -u origin master | git push -u origin master | ||
| − | |||
Our files can be seen in the GitHub page. | Our files can be seen in the GitHub page. | ||
[[File:web_github_page.jpg|thumb|center|Github page of the project]] | [[File:web_github_page.jpg|thumb|center|Github page of the project]] | ||
| Line 579: | Line 651: | ||
[[File:web_deploy_heroku.jpg|thumb|center|Deploy project at Heroku]] | [[File:web_deploy_heroku.jpg|thumb|center|Deploy project at Heroku]] | ||
| − | Find the repository on Heroku and press | + | Find the repository on Heroku and press '''Connect'''. |
[[File:web_connect_to_github.jpg|thumb|center]] | [[File:web_connect_to_github.jpg|thumb|center]] | ||
| − | There are two options | + | There are two options: '''Automatic Deploys''' and '''Manual Deploy''' |
| + | |||
| + | Go to '''Manual Deploy''' and press '''Deploy Branch'''. After the development stage, press '''View'''. | ||
[[File:web_manual_deploy.jpg|thumb|center]] | [[File:web_manual_deploy.jpg|thumb|center]] | ||
Latest revision as of 12:50, 30 April 2023
Introduction
United Nations (UN) have identified 17 interconnected goals to achieve a better and more sustainable future for all until the end of 2030. These Sustainable Development Goals (SDGs) range from ending poverty to ensuring gender equality. In order to address most of these goals, it is imperative to have a better understanding of geographic information science and technology, as any ‘event’ has a particular geographic location. The aim of this educational tutorial is to investigate the use of Free and Open Source Software (FOSS) to address SDG 16: ‘Peace, Justice and Open Institutions’.
Scope
The following educational material has been drafted within the framework of the 2019 OSGeo UN Committee Educational Challenge entitled ‘Open geospatial data and software for UN SDG 16, Peace justice and open institutions’. The seventh target of SDG 16 is to ‘ensure responsive, inclusive, participatory and representative decision-making at all levels’. Consequently, UN officers and patrols might need to collect geospatial data on the field to provide quantitative measures to address this target. In that respect, we have investigated the use of QField, which is an open source mobile data collection platform that could directly be connected to QGIS. The investigated tasks include real-time editing of geographic features, recording photos and developing a web-interface to display the collected data. There are several cloud based application development platforms and this tutorial relied on Heroku due to its support for PostgreSQL/PostGIS as well as different web programming languages. Any user could open a free account to test their ideas on Heroku.
Audience
We have prepared this educational material for researchers, educators and professionals in local, regional, national or international agencies with minimal geospatial information knowledge. We assume our audience has introductory knowledge of database management systems and programming. Nevertheless, the tutorial is intended to be self-contained meaning that anyone following the steps could understand and implement what had been achieved in this tutorial.
License
The development of this educational material was coordinated by Berk Anbaroğlu under the mentorship of Maria Brovelli, Serena Coetzee and Timur Obukhov. In addition, İhsan Buğra Coşkun and Mohammad Almasri contributed to the development of this tutorial. We would like to thank Agit Oktay for his support regarding the development of the web interface. Last, we would like to thank Matthias Kuhn who helped us with various issues regarding QGIS and QField, and for his suggestion to use Syncthing. The material is distributed under Attribution-ShareAlike 4.0 International (CC BY-SA 4.0) license. This entitles that the users of this tutorial could share and adapt this content as long as the attribution is provided and that the same license is used upon adaptations. This tutorial has been kindly supported by the 2019 OSGeo UN Committee Educational Challenge.
If you are using this tutorial for scientific research, please cite the paper:
Anbaroğlu, B., İ. B. Coşkun, M. A. Brovelli, T. Obukhov, and S. Coetzee. 2020. ‘Educational Material Development on Mobile Spatial Data Collection Using Open Source Geospatial Technologies’. Pp. 221–27 in The International Archives of the Photogrammetry, Remote Sensing and Spatial Information Sciences. Vol. XLIII-B4-2020. Copernicus GmbH.
Software Used
- PostgreSQL (Postgres) 11.5 is used to create the database that would store the collected data. PostGIS 2.5.3 extension is used to handle spatial data.
- QGIS 3.10 is used to create the project based on the data stored in the Postgres.
- QField 1.2.0 is used for mobile data collection and editing.
- Syncthing is used to synchronize collected photos.
- NodeJS 12.13.1 is used to visualize the collected data on the web.
- Visual Studio Code 1.41.0 is the Integrated Development Environment for developing the JavaScript code.
- Git is a version control system that is required to deploy the web based application.
Scenario
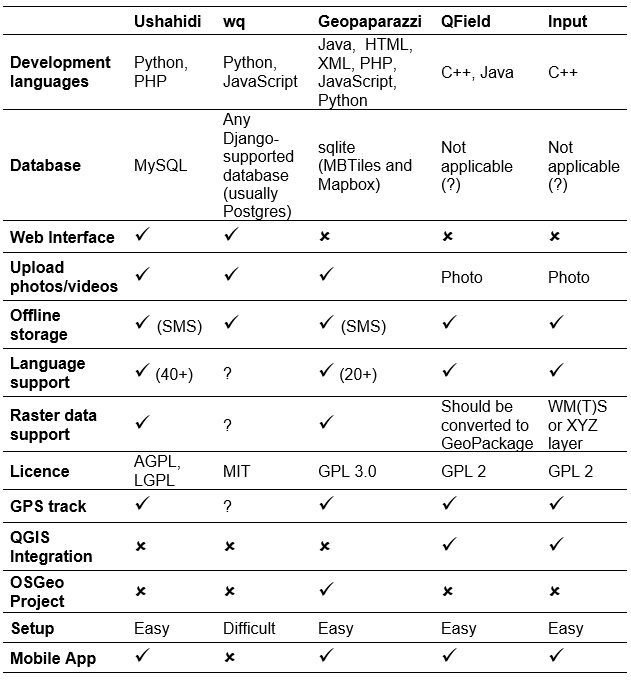
United Nations (UN) officers require mobile field data collection for various purposes, mainly of which is to provide reliable measures to the indicators of targets. It is necessary to provide an easy-to-follow tutorial that will ease the process of mobile spatial data collection of UN officers. This tutorial addresses some of the practical requirements of mobile spatial data collection including offline data collection, attaching photos to recorded events, editing of spatial features on the field and displaying the collected data on the internet through a simple scenario. There are several readily available open source mobile data collection platforms. These are compared as follows:
This paper relied on QField due to its ease of use and smooth integration with QGIS either by using the QField Sync plugin or its ability to process QGS files.
The scenario in this tutorial is recording the location and thematic information of trees in a region. Specifically, a lecturer specifies polygons for which each student is responsible. Thereon, students go to the field to collect the information regarding trees in that region. Some of the regions might have limited broadband coverage, which requires students collect offline data, and some students may capture photos of trees. Finally, it would be interesting to visualise the collected data on the internet so that decision makers (lecturers) could have a better understanding of over/under mapped regions. The scenario can easily be adopted for an operational task that necessiates mobile spatial data collection.
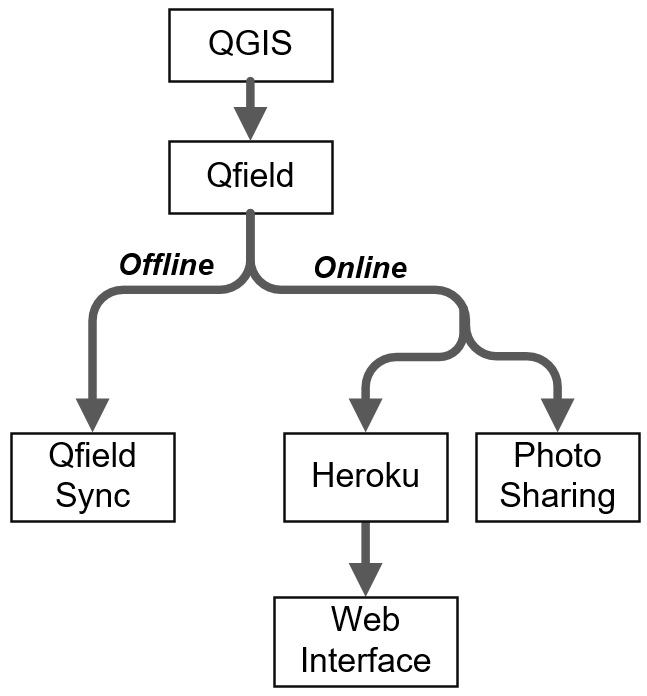
The overview of this tutorial is illustrated as follows:
The scenario utilised in this tutorial is recording the location and thematic information of trees in a region. Specifically, a lecturer identifies polygons in which each student is responsible for. Thereon, students go to the field to collect the information regarding trees in that region.
The code of the tutorial can be accessed from this GitHub repo.
Acquired Knowledge
After going through the entire educational material, one will be able to understand the process to develop a mobile geospatial data collection platform using technologies including QField, QGIS, Postgres/PostGIS and Syncthing.
Setting Up the Environment
This section describes the required steps to set up the development environment. In order to realise the steps described in subsequent sections in a smooth manner, it is recommended that the users:
- Open a Heroku account
- Install PostgreSQL and PostGIS on their local computer
- Connect the Heroku database from QGIS
- Set up the project in QGIS
- Transfer the project from desktop PC (QGIS) to mobile data collection platform (QField).
Opening a Heroku Account
A database server should be available in the web to initiate a mobile geographic data collection project. There are several solutions that offer a free solution to this. One of the platforms supporting Postgres and PostGIS is Heroku, which is a platform as a service (PaaS) that enables developers to build, run, and operate applications entirely in the cloud. Therefore, this tutorial relied on Heroku to set up the database on the cloud.
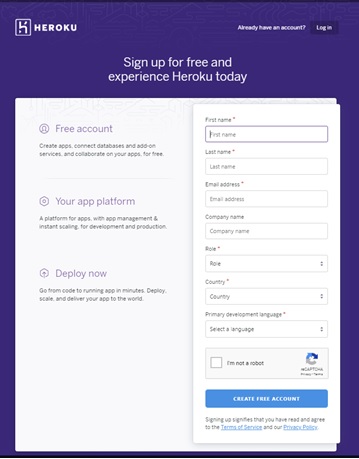
The sign up page of Heroku requires some personal information such as name, surname and email address.
Once the form is submitted, an email is sent to verify the account. These credentials is used to create a new app.
The second step is to create a Heroku app with a Postgres database. Steps are as follows:
- Log in to your Heroku account.
- Click "New" → "Create New App" (→ symbol is a left click and ⇒ is a right-click)
- Create New App
- Provide a unique app name. Heroku acknowledges if the provided app name is unique.
- There are two regions: "United States" (default) and "Europe". You may leave it as it is.
- Finally, click "Create app".
- Go to https://dashboard.heroku.com/apps and choose the app you just created.
- Click on "Resources" tab.
- Under "Add-ons" type "Heroku Postgres" and click on it. Finally, complete the Postgres deployment by clicking on the "Provision" button.
- To see the database credentials:
- Click on the settings symbol located on the top-right corner.
- Click "Data".
- Select your application.
- Go to "Settings" → "View Credentials".
Accessing the Heroku Database
A user interface can be used to manipulate a Postgres database such as pgAdmin or DBeaver.
This tutorial relied on pgAdmin 4, and one it is installed, we can connect to our Heroku database with the following steps:
- Right click on Servers → Create Server
- Click on General and provide a name for your server (e.g. heroku).
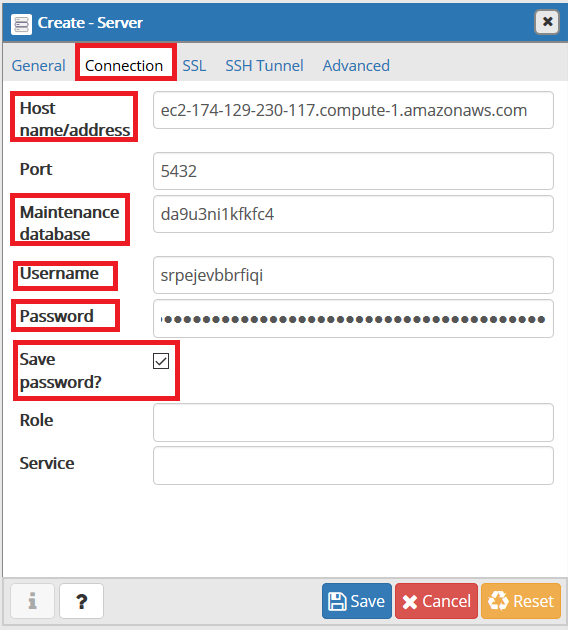
- Go to the Connection tab, and enter the Heroku database credentials that you have previously obtained.
- Host name/address: Host
- Maintenance database: Database
- Username: User
- Password: Password (check the ‘Save password’ box for ease of login in future)
- Finally go the Advanced tab and state the name of the database next to DB restriction, so that only the relevant database would be visible on your screen.
It is now possible to create the tables. To open the query window, right click on the database and select the Query Tool.
The scenario for this tutorial requires three tables: i) trees and ii) regions are tables with a spatial aspect, whereas tree_type do not have a geometry and are used to ease the process of data collection. In addition, multiple languages are supported in a more convenient way.
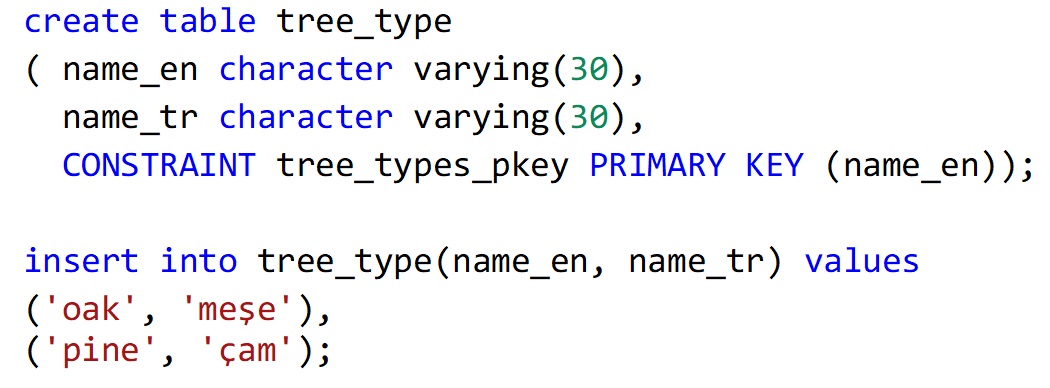
First, let us create the tree_type table. The following code creates two different types of trees (pine and oak) in two different languages (English and Turkish).
The other two tables possess a spatial component. Therefore, the first step is to activate the extension postgis, which is achieved using the create extension postgis statement.
The SQL statements to create the trees and regions tables are as follows.
The following attributes are included within the created tables:
- trees
- t_type is the type of a tree.
- height is the height of a tree.
- id is the unique identifier of a tree.
- loc is the location of a tree in WGS 84.
- observation_time is the date-time of an observation.
trees table has a point geometry indicating the latitude and longitude of the observed tree as well as the tree type, height and observation time. The second table, regions include a polygon geometry indicating the areas in which each student is expected to carry out data collection. Students’ names can be included in the 'responsible' attribute.
Connecting the Database with QGIS
The Postgres database created in the previous subsection can be included directly into a QGIS project, thanks to the seamless linkage between QGIS and Postgres.
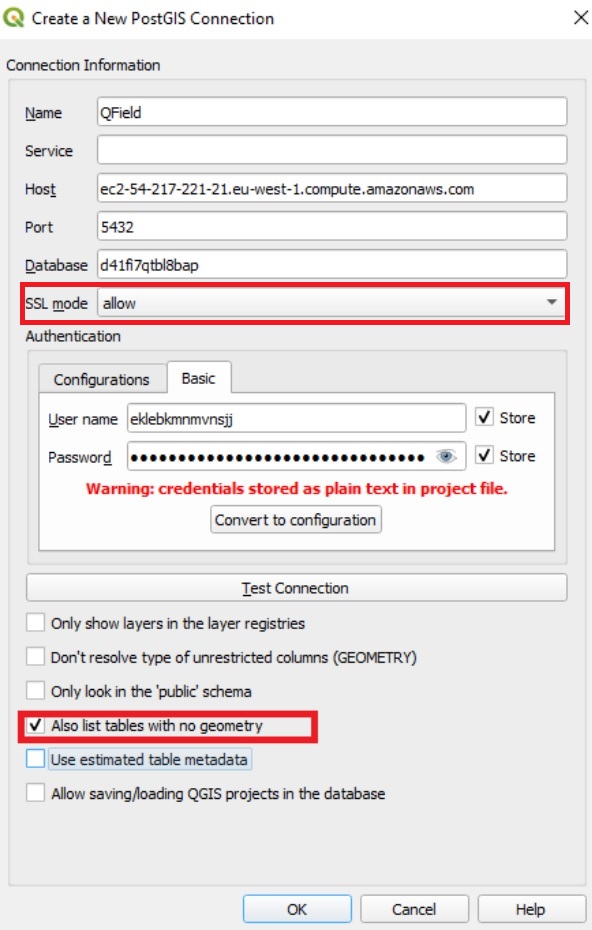
Once PostGIS is right-clicked, and New Connection is clicked, the following interface opens in which you can provide database credentials of the Heroku database.
Details you have to provide:
- An arbitrary Name
- Host, Port and Database should exactly be the same as it appears on the Heroku page.
- SSL mode should be allow.
- Go to Basic tab under Authentication, and you store the user name and password in order to ease the process of real time data collection.
- Do not forget to check the box Also list tables with no geometry to obtain all the tables of the database.
If all the credentials of the Heroku database are entered correctly, clicking the Test Connection button pops up a window indicating the success of the connection.
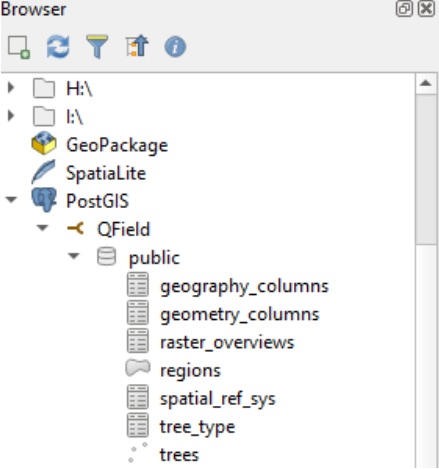
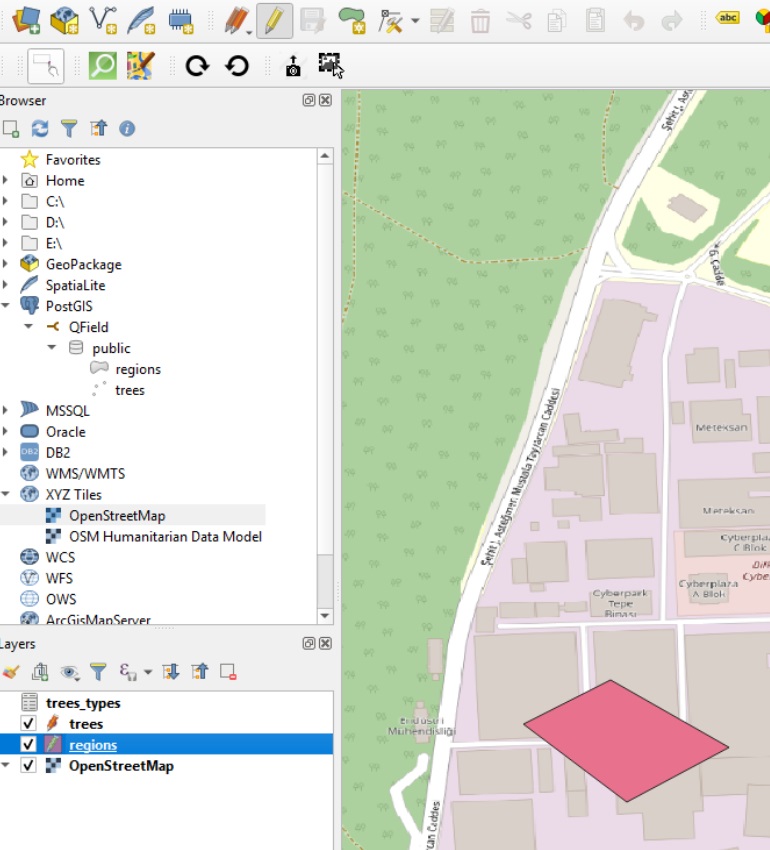
Finally, once the OK button is clicked, the connection appears on the Browser panel as shown below, and the user can add all the relevant tables to the layer panel by double-clicking on the table.
Setting Up the Value Relations in QGIS
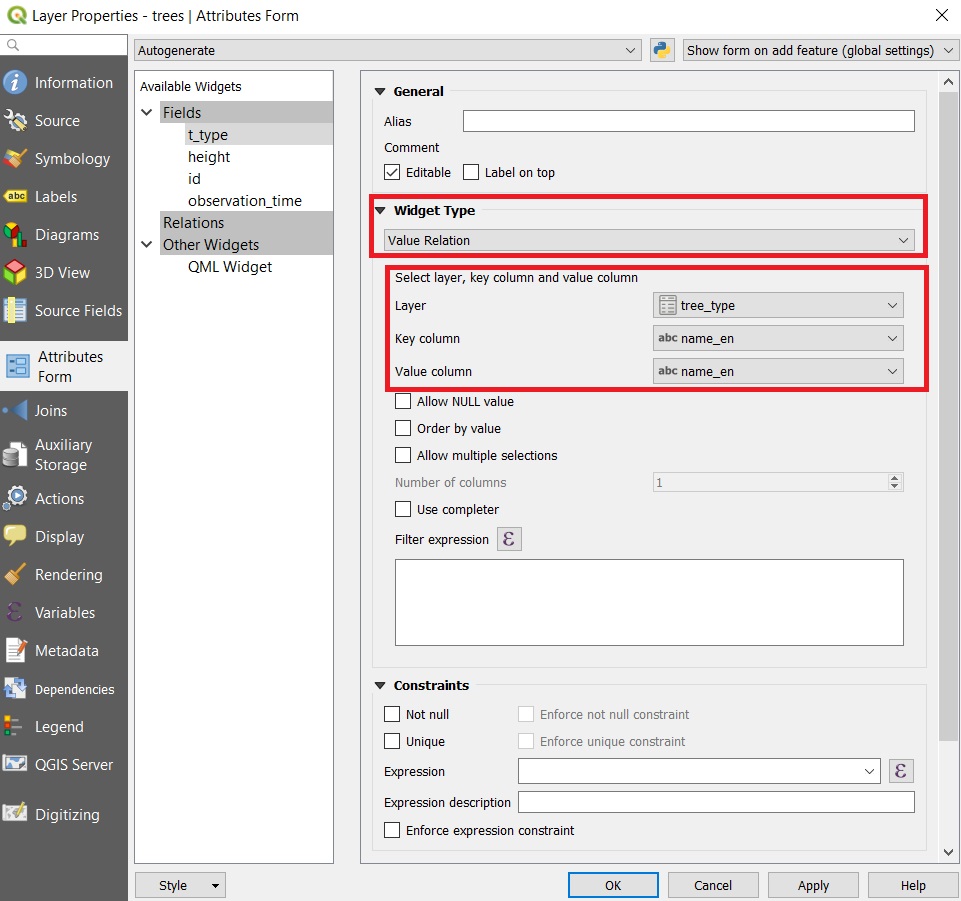
In order to ease the process of data collection, it is useful to explicitly state the value relationships between the feature layers and to improve the user experience by hiding some of the details. For instance, a student can only select one of the pre-defined tree types instead of typing it. This can be achieved by adjusting the Attribute Form specified under the Properties of the trees layer as shown below.
The tree type attribute t_type has a value relation to the tree_types table. In order to realise this relation. The following settings are specified:
- Widget type: Value Relation
- Layer: trees_type
- Key column: name_en
- Value column: name_en
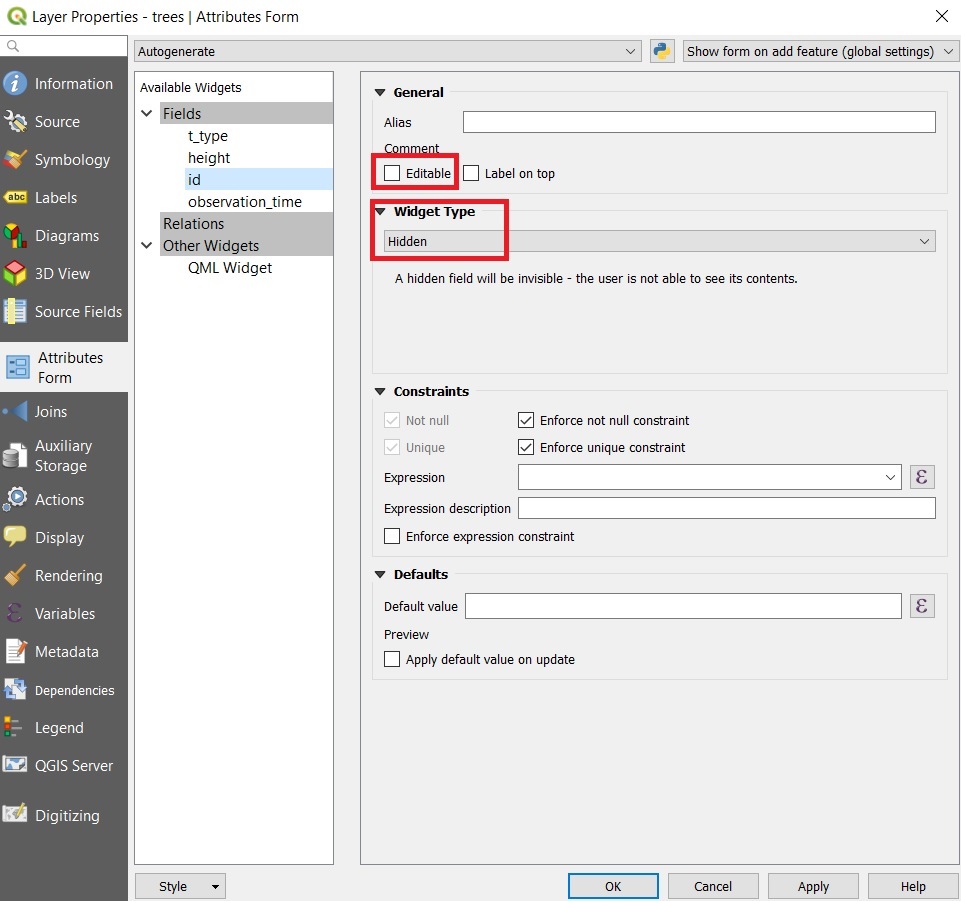
In addition, some of the attributes might better be hidden from the users such as the id attribute of the trees or regions as it is a serial number that auto increments as a tree/region is recorded. Therefore, this attribute shall not be editable. In addition, it can be hidden from the user to reduce clutter in the GUI of the QField. This process is illustrated as follows.
- Uncheck Editable
- Widget type: Hidden
Once an attribute is hidden, it means that during data collection that field is not displayed to the user. However, a user could still update it under the attribute table. In order to prevent this as well, we have unchecked Editable.
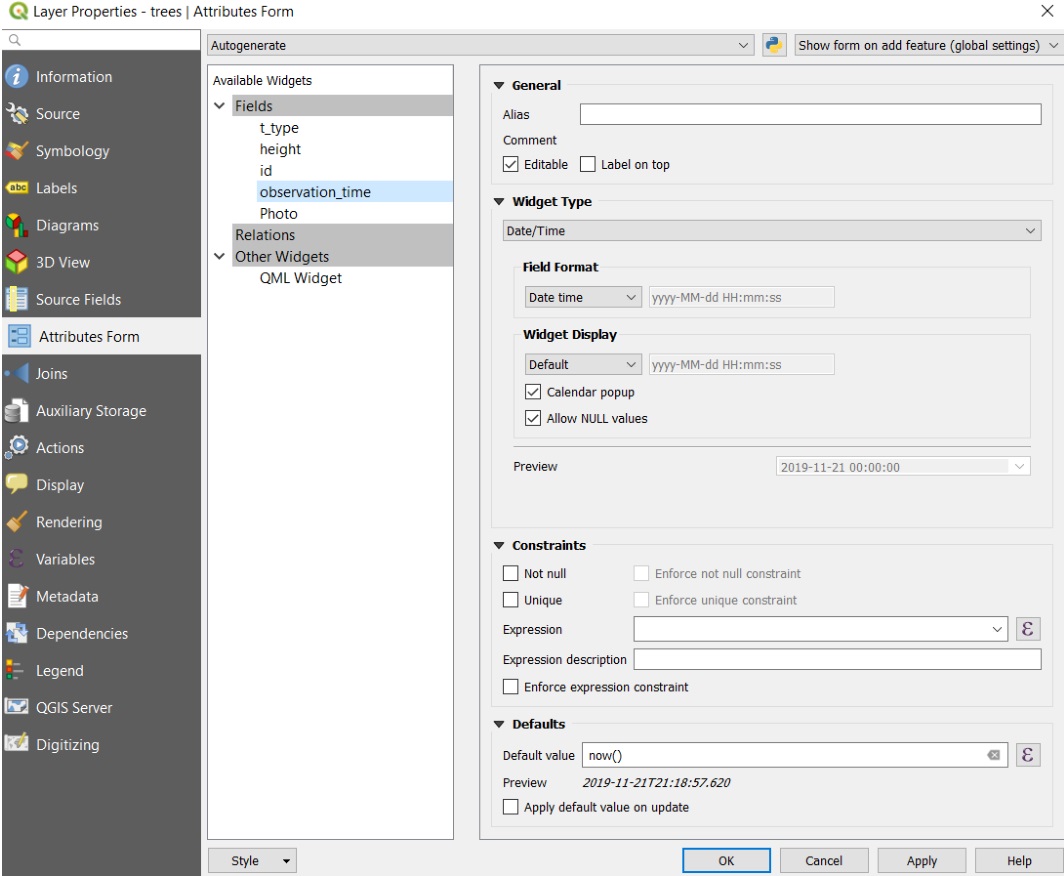
The last attribute of the trees layer is the observation time. It might be important to record the observation time in order to facilitate further spatio-temporal analysis. At the moment, it is possible to record the height of the same tree at two or more distinct time intervals.
Update the default value of the observation_time attribute to be now() as shown in the figure below. In this way, whenever a tree is recorded, its observation time is also recorded.
Actions:
- Widget Type: Date/Time
- Default value: now()
If the mobile data collection platform assumes internet connection, then including OpenStreetMap in the QGIS project may ease data collection process. Install the OpenLayers plugin, and include OpenStreetMap in your project.
Transferring the Project to QField
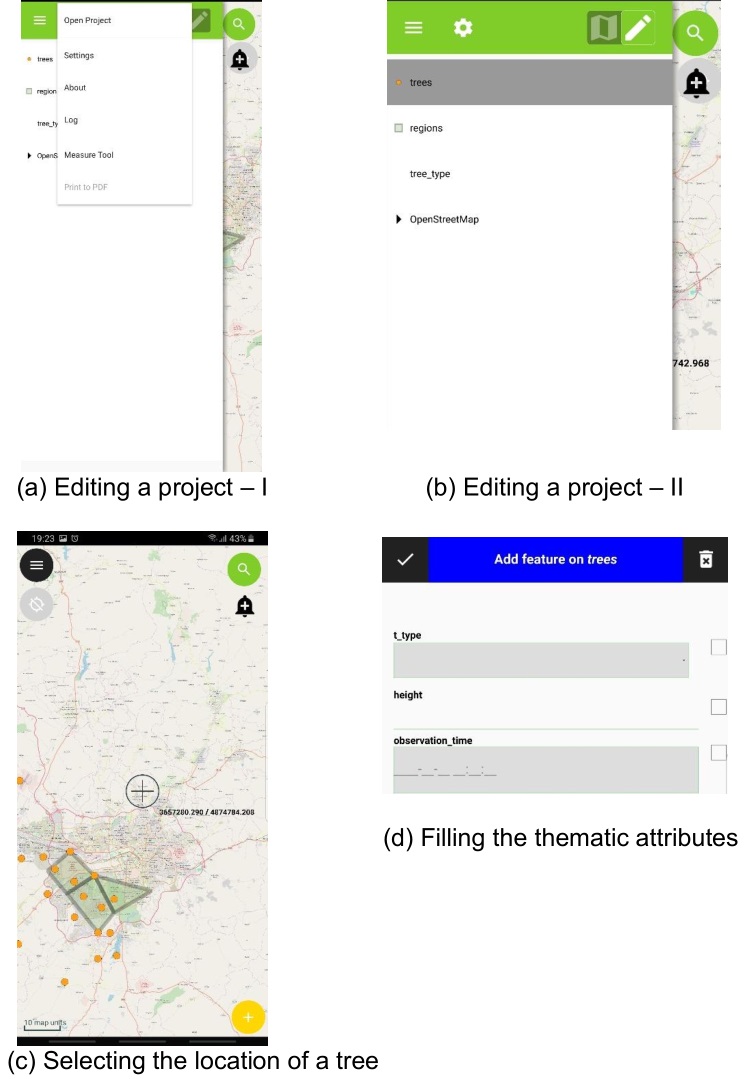
Once all the layers are added, the project is saved as a QGS file. This means that the file is a legible XML document. All of the details of the project are included in this document including the credentials of the Heroku database. Anyone possessing this QGS file can start collecting field data, which would have immediate effect on the Heroku database. In this way, multiple users can effectively collect field data into the same database. This file can directly be transferred to the smart phone or tablet possessing QField.
Once the QGS project file is transferred to the mobile device, it can be opened using QField as shown in (a). The layers appear just like they do in QGIS,as shown in (b). In order to start editing, the relevant layer is selected and then the pen icon is toggled in the upper-right corner of the screen. Once the horizontal lines button on the upper left corner is pressed, the user can start collecting data. The location could either be set by panning around the map and clicking on the '+' button located at the bottom-right of the screen or by clicking the locate button at the left-hand side of the screen, which uses the GNSS receiver of the phone to locate the position of the user. New features are added just like they are added in QGIS with the functionality of hiding some attributes (e.g. id in trees) or by offering a drop-down list to the user (e.g. user can select one of the pre-defined tree types).
Collecting Photos in the Field
Photos can be used in mobile data collection projects to better describe a spatial object. Storing photos in a database is not trivial, and most of the time the path to the photo is stored. For this reason, an additional platform is needed to share photos where multiple users capture photos and synchronise them.
Setting Up the Snycthing Environment
Syncthing is a continuous file synchronisation program. It synchronizes files between two or more devices. The location of the shared folder is specified on Syncthing. It requires internet to synchronise the files. The aim of using Syncthing in this project is synchronising photo folders between mobile device and computer.
Firstly, Syncthing must be installed on all devices. It can be downloaded for Windows from here. There are two options as x64 and x86. The suitable option can be downloaded. Note that SyncTrayzor is the name of the software on the desktop.
Likewise, the app Syncthing must be installed on the mobile device. It can be downloaded to android devices through Google Play.
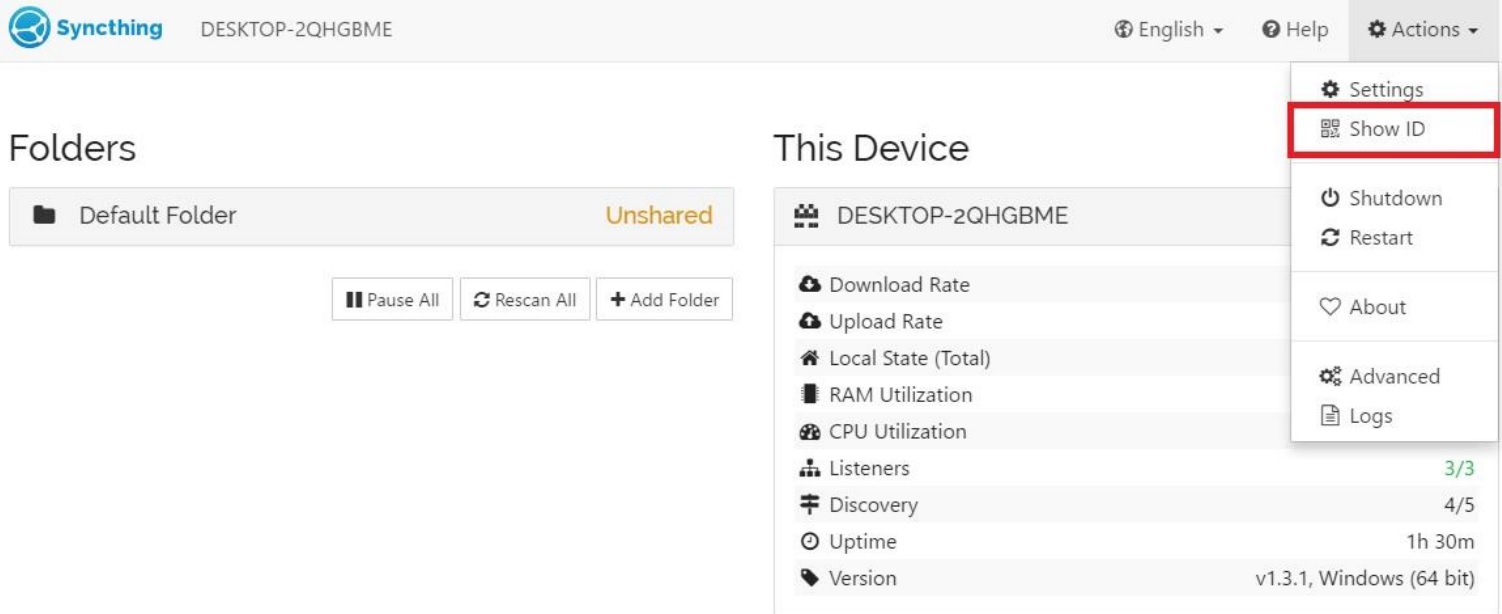
Having installed Syncthing on PC and mobile devices, they are required to be connected. Open SyncTrayzor on your desktop. Go to Actions → Show ID as shown below.
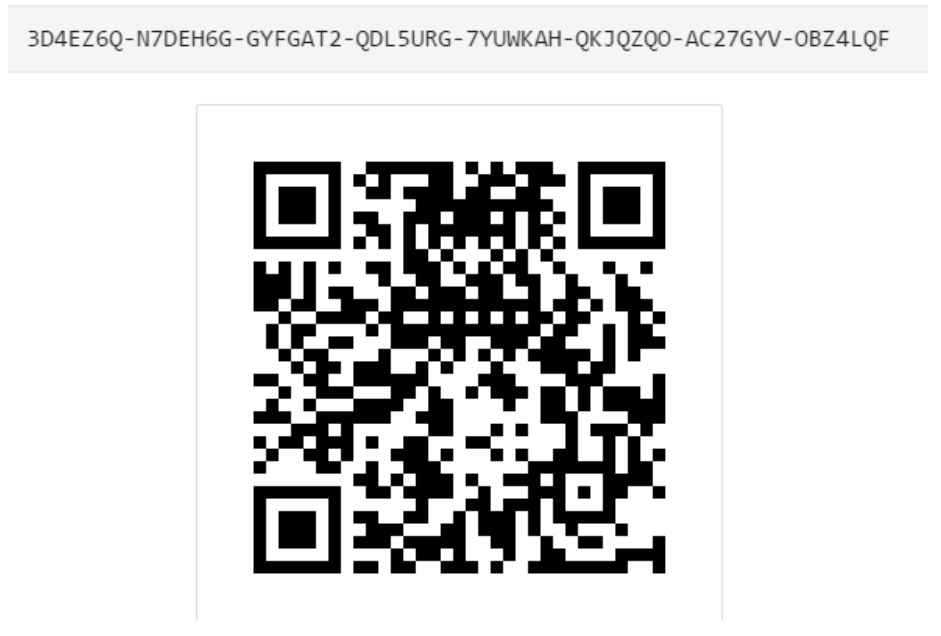
The ID of a device is presented as a text and QR code as shown below.
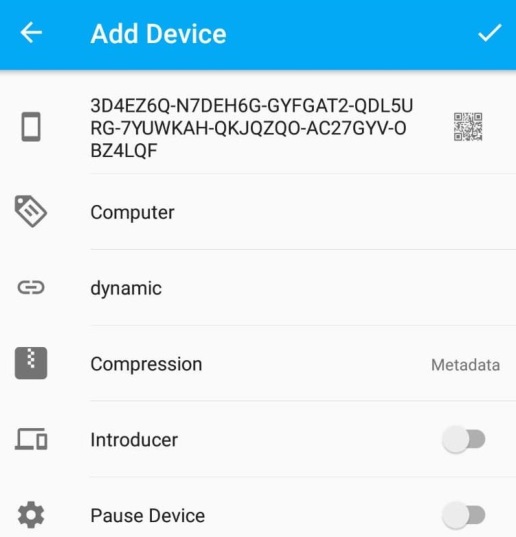
This code must also be entered to the mobile device. Press the '+' button in the Devices menu as shown below.
Device options will be shown. Enter the connection ID and connection name. Also, QR code can be used to add the PC as illustrated below.
Once the PC is added to the mobile, this action sends a request to the PC stating the details of the connection. Press Add Device as shown below.
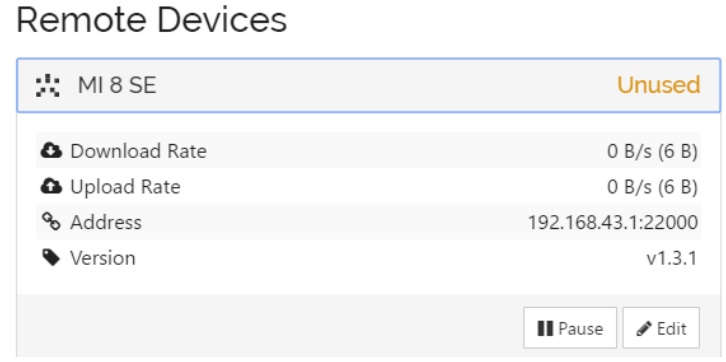
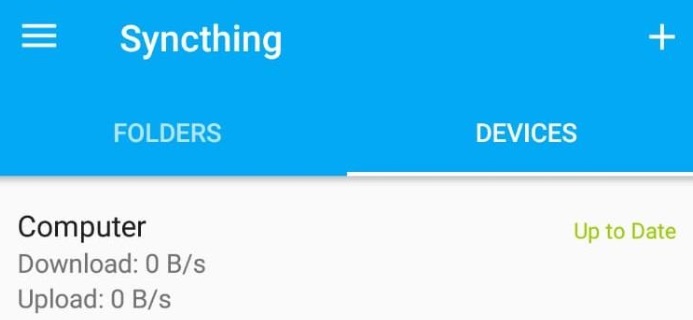
After acceptance, connections will be established between the mobile device and the PC, which can be seen in SyncTrayzor as follows. The mobile device used in this tutorial is MI 8 SE.
Also, Syncthing on the mobile device displays the connection information as shown here:
Having reached this step means that the mobile device and PC are synchronised. One may add further mobile devices with the same procedure. Once the connection is established between the devices, the details regarding file synchronization must be provided.
Updating the QGIS Project
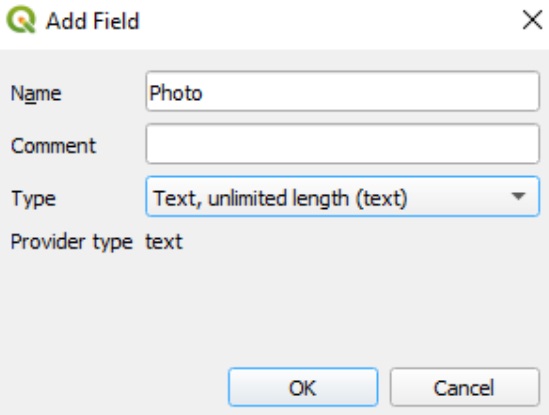
The path of the captured photos must also be stored in the database. There are two different ways to add a 'photo' attribute to the 'trees' layer. First, the attribute can be added when creating the table in the database. The data type can be chosen as text, whih corresponds to the URL of the image. Second, it can be added from the QGIS project. This tutorial relies on the latter option.
Open the attributes table. Right click the 'trees' layer and click 'Open attributes table'. Then follow these steps:
- Press the 'Toggle Editing Mode' which is shown with button '1'.
- Press the 'New Field' button which is shown with button '2'.
After that, enter the column name and select the data type. Select type as 'Text, unlimited length (text)', and then click OK.
Finally, click on 'Toggle Editing Mode' to end editing, and press save.
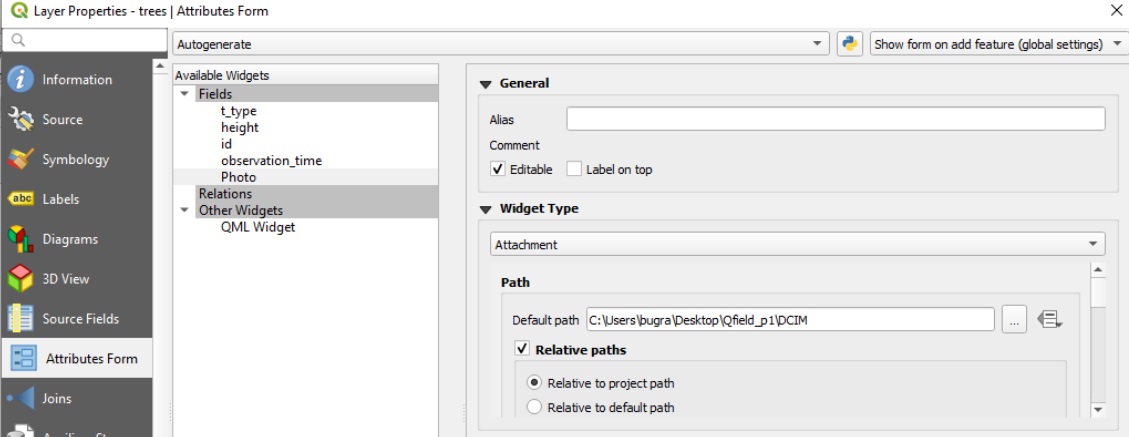
The following adjustments have to be satisfied to display photos on QGIS:
- Right click to 'trees' layer and press properties
- Go to Attributes Form
- Select the Photo column
- Select Widget Type as Attachment
- Enter default path of DCIM folder
- Select Relative paths and leave the default option checked Relative to Project Path
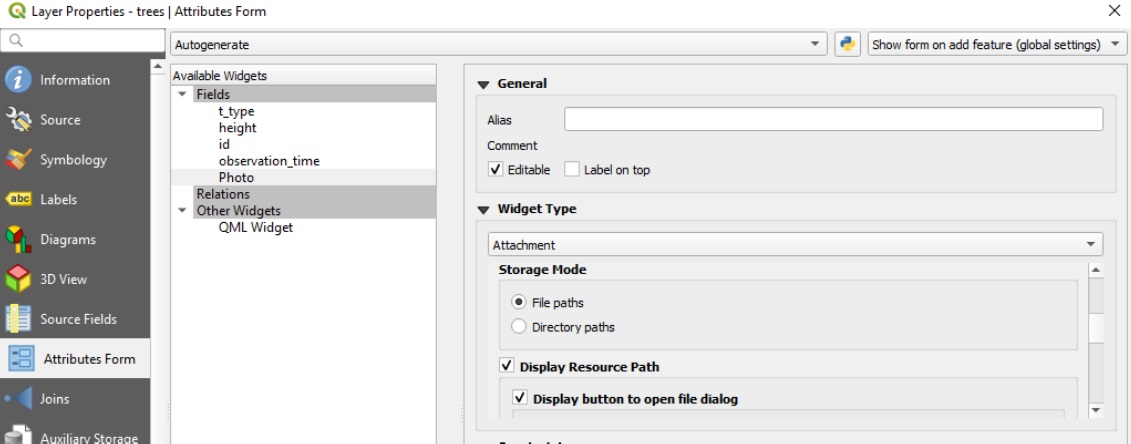
Continue with the following steps:
- Under Storage Mode select File paths
- Check Display Resource Path
- Check Display button to open file dialog
- Finally, select the Integrated Document Viewer as Image
Press the apply button. The project is now ready to display photos of trees.
Transfer the project folder containing:
- the updated QGS file (osgeo_challenge2_2019_w_photo.qgs) and
- the DCIM folder that you will now share
to your mobile device.
To synchronise the photo folder with the connected devices, press Add Folder in the SyncTrayzor as shown below.
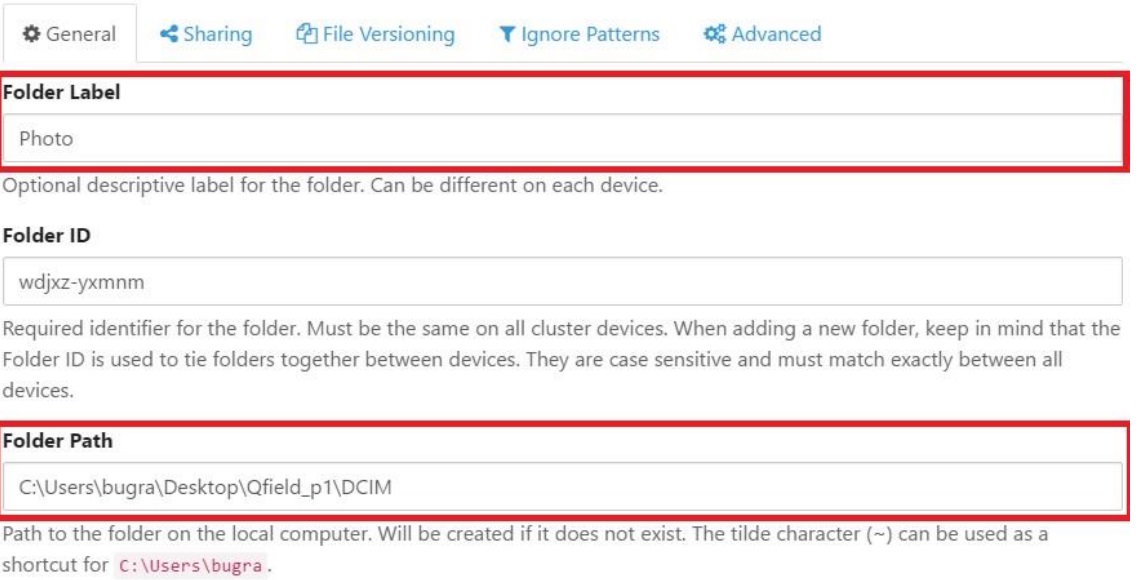
Enter the folder name and folder path. It is important to enter the file location correctly as shown below.
Select the mobile devices you want to synchronize the folder that contains photos in the Sharing option and press Save button.
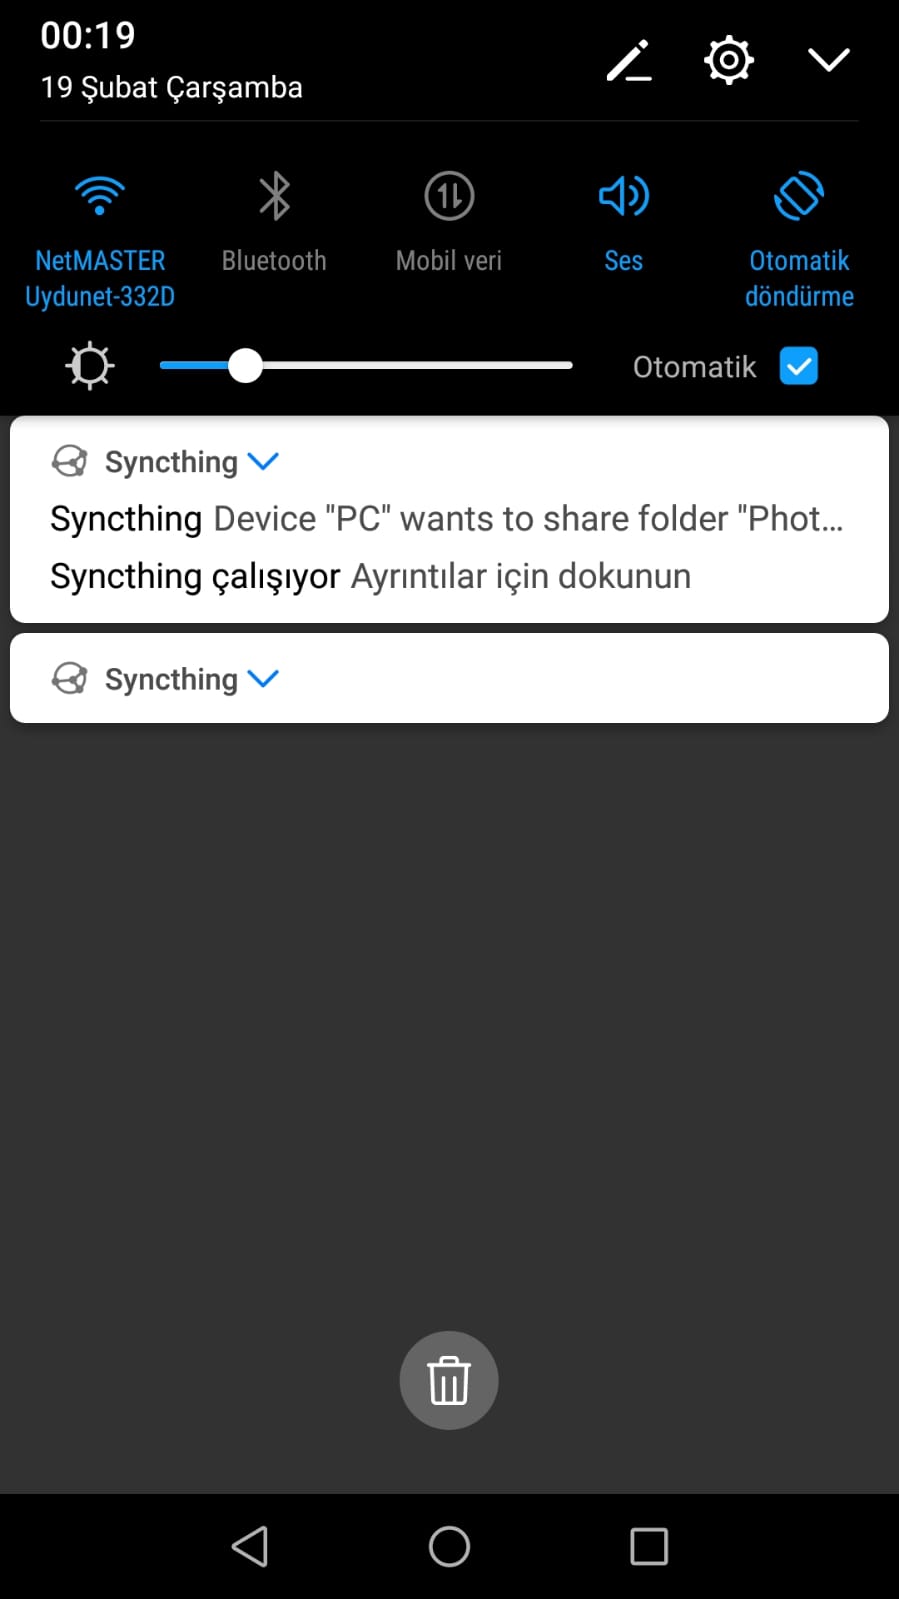
This sends a request to the mobile device(s) selected for acknowledgment. Please note that
- this request appears only in the pull-down notification bar as shown below and
- it might take a while since mobile devices can easily get disconnected.
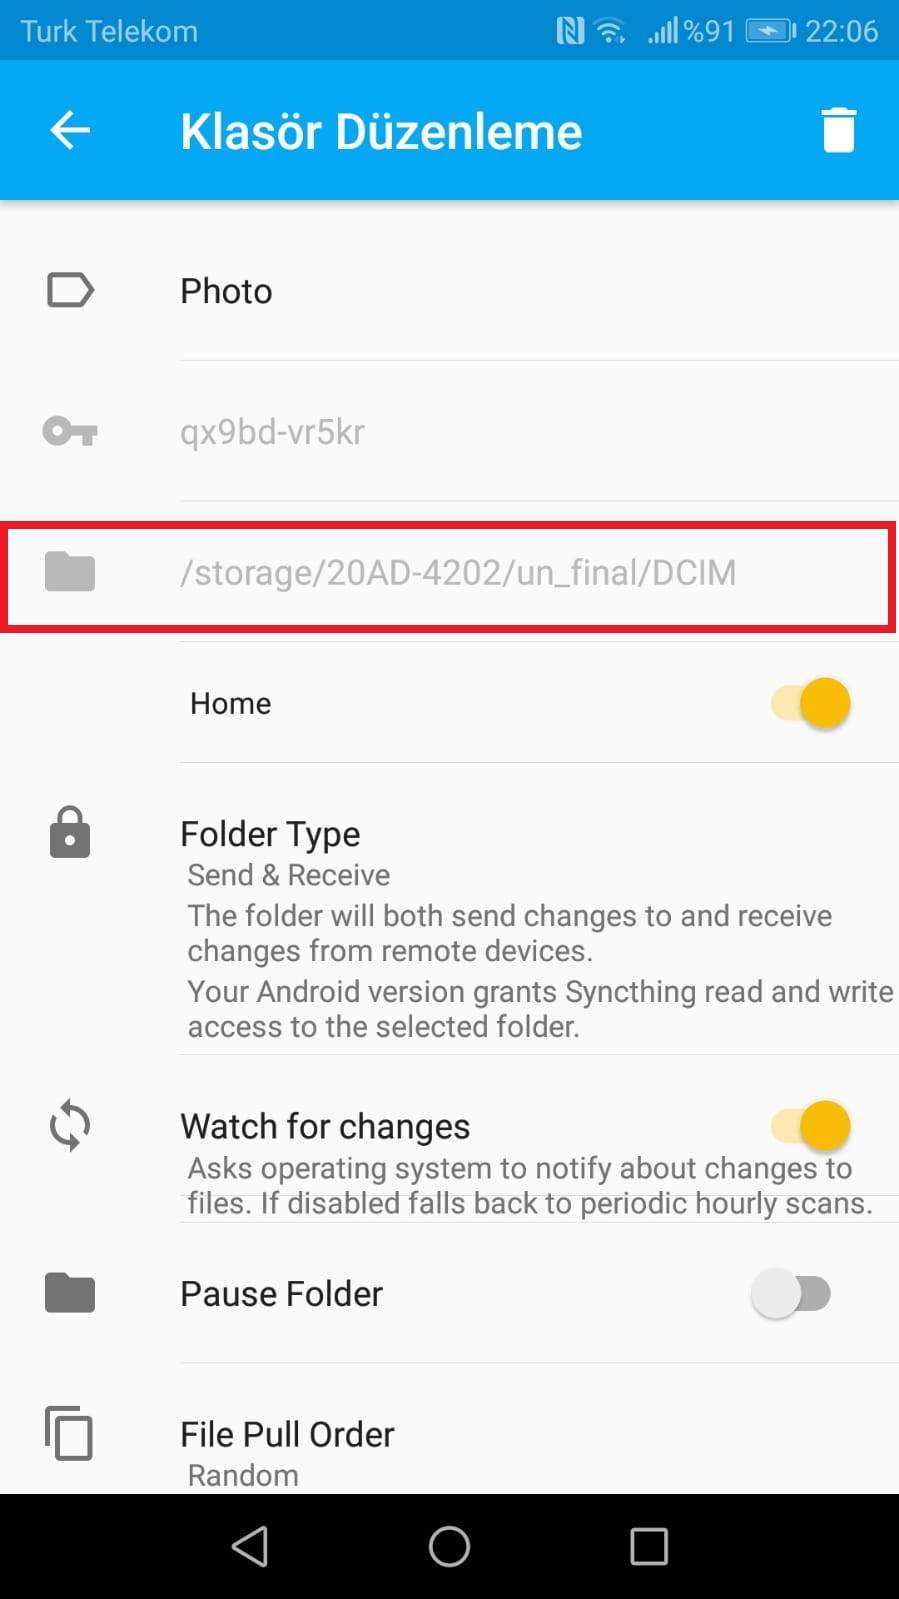
Select the DCIM folder that you previously transferred to finalise the synchronisation setup on your mobile device as shown below. Note that it is the same folder that you transferred to the mobile device (i.e. DCIM folder under the un_final folder).
Now the synched mobile devices are ready to take photos. The photos will be synched with the PC as well as with other synched mobile devices.
Collecting Photos on the Field
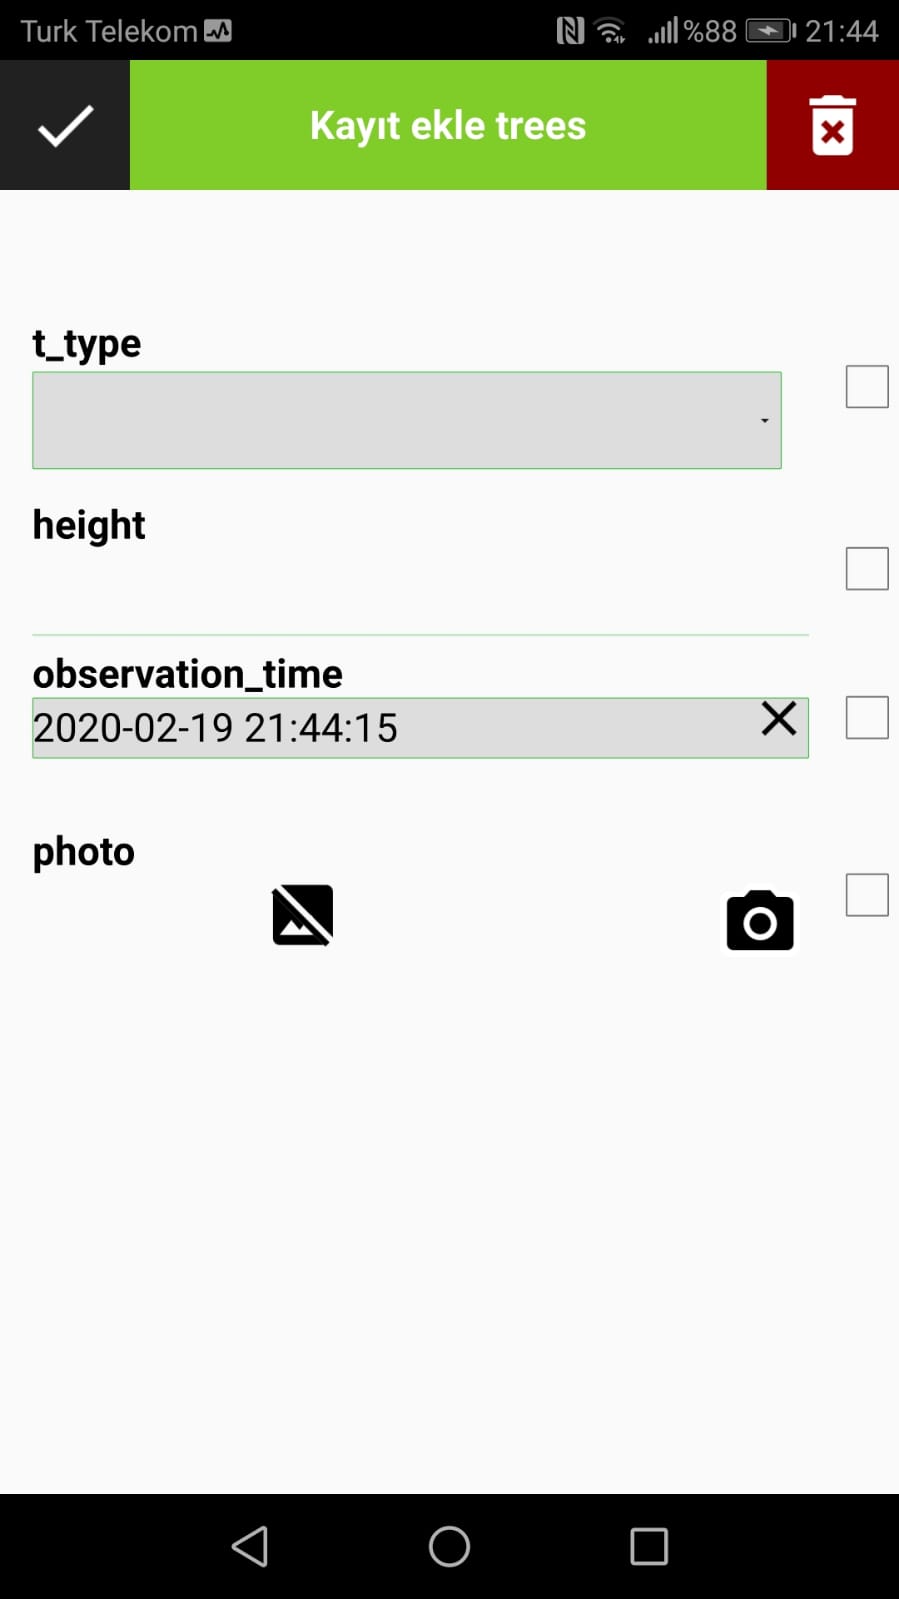
Open the updated QGIS project file (osgeo_challenge2_2019_w_photo.qgs) in QField and record an observation. The following screen will pop-up:
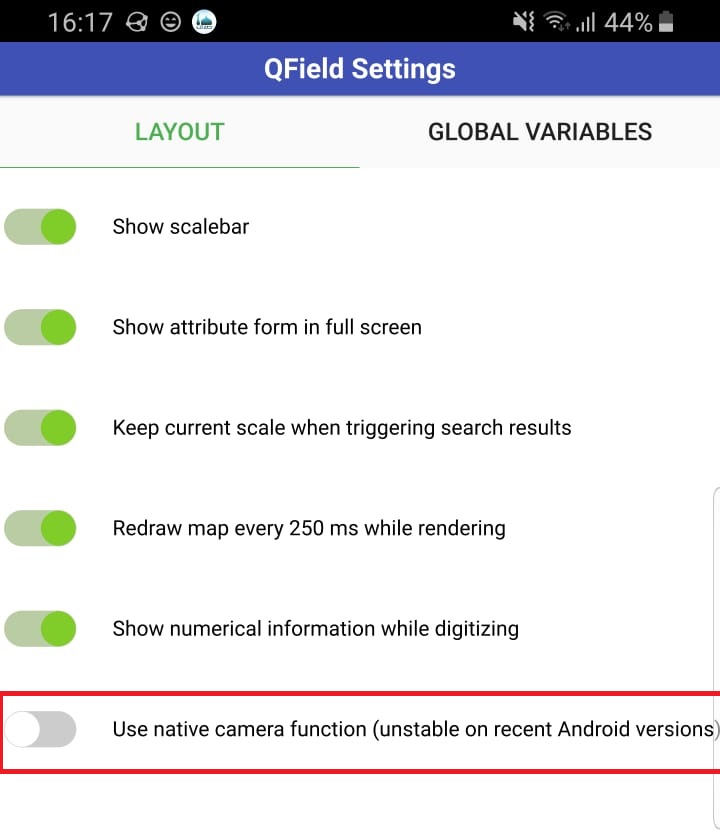
Once the camera icon is clicked, camera opens an a photo can be captured. If there is a problem at this point, make sure that the Use native camera function is turned off under QField Settings as shown below:
The captured photos will be synched with all the connected devices. Consequently, a captured photo of a tree can also be visualised in QGIS:
Offline Data Collection
QField allows its users to collect data when there is no internet connection. This requires the use of the QField Snyc plugin, which can be installed from the QGIS plugin repository.
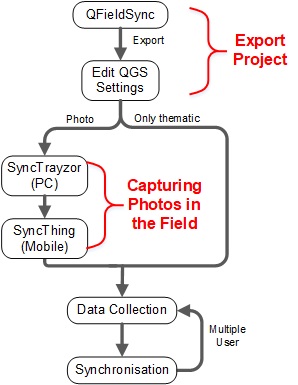
The overall process of offline data collection is illustrated below:
First, is setting up the environment. We need to export the QGIS project using the QFieldSync plugin, and update the QGS project file as this process might change some of the existing settings. Thereon, we need to rely on Syncyhing if photos are going to be collected in the field, or otherwise we can start collecting field data. Once we have internet connection again,the folder would be transferred to PC and QFieldSync will be used to synchronise the project.
Export Project
The first part is to export the project so that all the database is backed up to a Geopackage file (gpkg) that QField can update.
The required steps are as follows:
- Under Plugins → QFieldSync, select Preferences as shown in (a) below. Clicking on this button opens the window presented in (b).
- Set the Default Import Directory to be the path of the project.
- Set the Default Export Directory to be the path of the files that are to be exported. This directory must be copied to the mobile device.
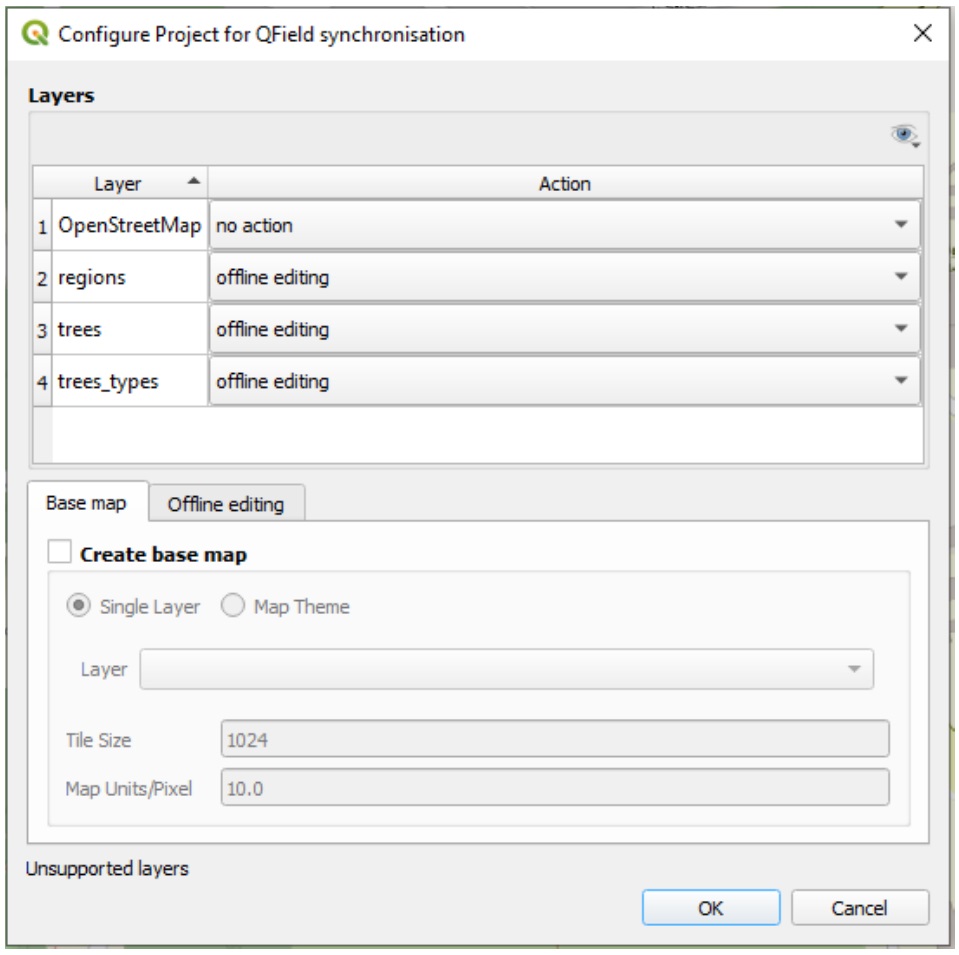
- Select Project Configuration, which opens a window as shown below listing the available layers and actions that can to be taken for each of them.
- For OpenStreetMap, select no action.
- The other layers should be in the offline editing mode.
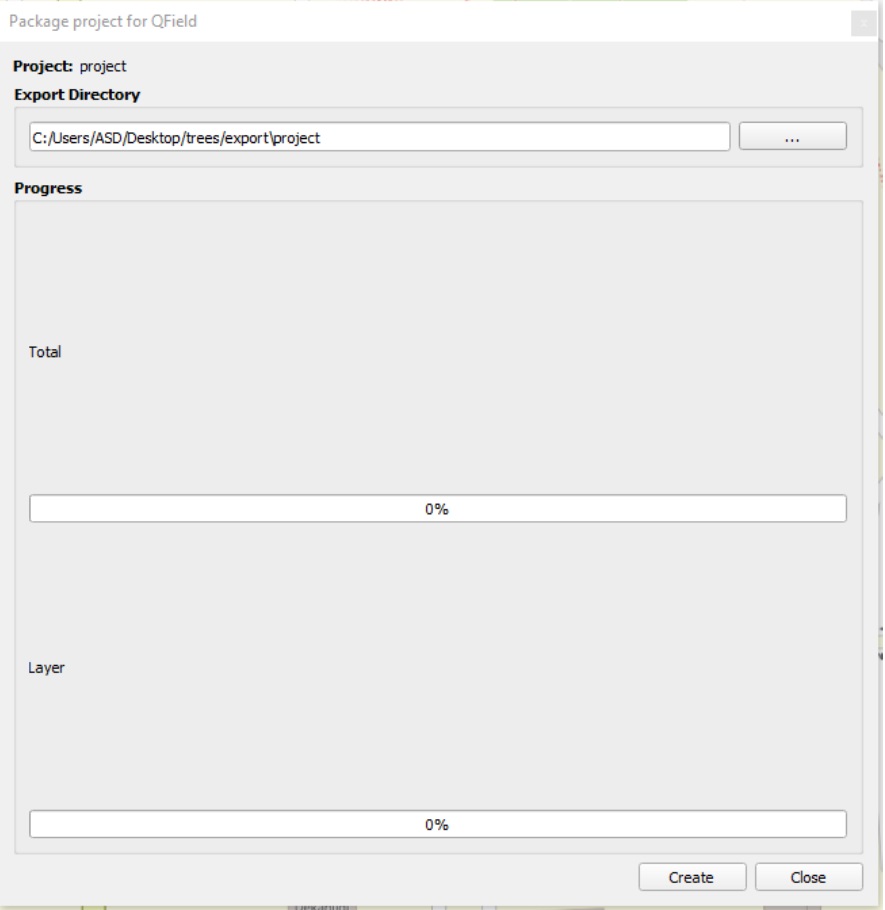
- Select Package for QField, which opens the following window. Select the export directory, which can be the same directory as previously. Once the Create button is clicked, the plugin creates the required Geopackage file and associates it with the QGS file. In this way, data are stored in a Geopackage file.
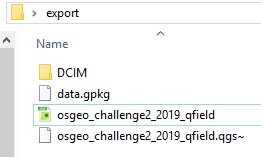
Note that once the export folder is successfully created as shown below, it may disrupt the project file. For example, the drop down list to select the tree type, which otherwise works when the QGS file is transferred directly to QField, does not work any more.
Open the new project file in QGIS and make sure that all of the settings are correct.
Finally, open a DCIM folder, which will be used to synchronise photos that are captured offline.
Capturing Photos in the Field
Continue with the following steps while you have internet connection:
- Transfer the project to the mobile devices. Multiple users can collect offline data.
- Open SyncTrayzor (PC) and share the DCIM folder with other devices.
- Syncthing will ask you to accept the request on your mobile device. Accept it and select the DCIM under the export folder. In this way, all the photos captured in QField will be stored under the DCIM folder, which would then be synchronised.
Data Collection
At this stage, we do not have internet connection any more. Nevertheless, we can collect field data with the following steps:
- Open the project available under the export directory in QField.
- Collect field data.
- You can also update existing records, such as changing the height of an existing tree.
Now we are ready to synchronise data we have just collected. For this, we need to have internet connection.
Synchronisation
Once you have internet connection again, do the followings to synchronise:
- Transfer the export folder in your mobile device back to your PC.
- Open GIS.
- Under QFieldSync plugin select Synchronize from QField, which opens up a window as illustrated below.
- Once the Synchronize button is clicked, all of the content of the Geopackage is read and the Heroku database is updated accordingly.
- Save the QGS file.
- You can repeat the process of synchronising for other devices by repeating this last process.
Web Interface
This section describes how to visualise the data stored in the database on the web. First, the section provides a brief introduction on the required technologies, including NodeJS, Visual Studio Code and GitHub. Second, the code is presented that can be used to visualise the collected field data.
Technologies
NodeJS
NodeJS is an open-source, cross-platform, JavaScript runtime environment that executes JavaScript code outside of a browser. It can be downloaded from here.
Visual Studio Code
Visual Studio Code is a source code editor that can be used with a variety of programming languages. It is developed by Microsoft for Windows, Linux and macOS. It can be downloaded from this link. The version used for this tutorial is 1.40.1.
Git Git is a software development version control system. In order to effectively upload our project to GitHub, Git must be downloaded from this link.
Create Desktop App
Create an empty folder on the computer.
Open Visual Studio Code. Go to File → Open folder.
Then go to Terminal → New Terminal.
It opens a terminal screen below the screen. Write npm init on the terminal screen end press enter. It asks some questions to create package.json, which holds various metadata relevant to the project.
Press enter for all of the questions. The metadata file package.json is created at the end of this process. Once all the default values are accepted, the package.json looks like:
Some JavaScript packages need to be installed. These packages will be installed via npm (Node Package Manager). Packages to install are listed as follows:
- Express Module
Express is a minimal and flexible Node.js web application framework that provides a robust set of features to develop web and mobile applications.
In terminal write the following and press enter:
npm install express --save
- File System Module
This allows to work with the file system on your computer.
In terminal write the following and press enter:
npm install fs --save
- Bluebird Module
Bluebird is a fully featured library with focus on innovative features and performance.
In terminal write the following and press enter:
npm install bluebird --save
- Pg-Promise Module
Pg-promise is a PostgreSQL interface for NodeJS.
In terminal write the following and press enter:
npm install pg-promise --save
The package.json will be updated once these packages are installed, and will look this. Notice the dependencies:
Project settings are ready.
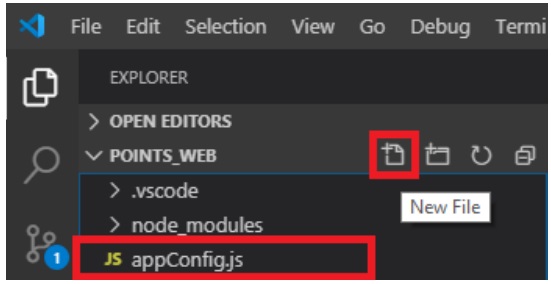
Now, we need to establish the database connection. Click the New File button, and add appConfig.js file.
The appConfig.js would include the database connection settings (for now it is the localhost) and the entire content of the file should be:
var developmentDatabase = {
postgres: {
host: 'localhost',
port: 5432,
database: 'database_name',
user: 'postgres',
password: 'postgres'
}
}

var connectionString = "postgressql://user:password@host:port/databasename?ssl=true";
if (process.env.NODE_ENV == 'production') {
//Production mode
if (process.env.DATABASE_URL) {
developmentDatabase =
parseConnectionString(process.env.DATABASE_URL);
} else {
console.log("process.env.DATABASE_URL empty, connectionStringvariable used");
developmentDatabase = parseConnectionString(connectionString);
}
}else{
//Development mode
developmentDatabase = parseConnectionString(connectionString);
}
function parseConnectionString(connectionString) {
if (connectionString) {
var myRegexp = /(\w+):(\w+)@(.+):(\w+)\/(\w+)/g;
var match = myRegexp.exec(connectionString);
if (match.length == 6) {
developmentDatabase.postgres.user = match[1];
developmentDatabase.postgres.password = match[2];
developmentDatabase.postgres.host = match[3];
developmentDatabase.postgres.port = Number(match[4]);
developmentDatabase.postgres.database = match[5];
developmentDatabase.postgres.ssl = true;
return developmentDatabase;
}
}
console.log("connectionString cannot be parsed");
return null;
}
module.exports = {
hostname: "http://localhost",
port: 5656,
database: {
postgres: developmentDatabase.postgres
}
}
The only statement that requires to be changed regarding the credentials of the Heroku database is the connectionString.
This statement should be updated based on the credentials of the Heroku database, which can be found through Settings → View Credentials.
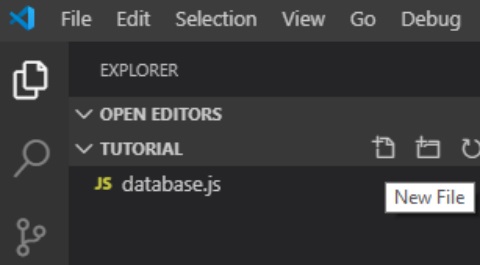
After that, data stored in the database must be retrieved. For this, we need to create a new file database.js:
The connection is applied from appConfig.js and the query is applied in this script. The important thing is the query at this point. Check that your table name and queries correspond to those in your database. The content of the database.js should look like:
const fs = require('fs');
var promise = require('bluebird');
var CONFIG = require('./appConfig');
var pgp = require('pg-promise')(options);
var DATABASE_PGB = pgp(CONFIG.database.postgres);

module.exports = {
       getAllLocations: getAllLocations
};

var options = {
    promiseLib: promise
};

function getAllLocations(cb) {
      DATABASE_PGB.any('SELECT ST_X(loc) as longitude, ST_Y(loc) as latitude from trees')
      .then(function (data) {
         cb(null, data);})
       .catch(function (err) {
          cb(err)});
}
Finally, the web site can be created. Press New File and create the index.html file.
The background map is obtained from OpenLayers. The query response returns a GeoJSON file. Therefore, Jquery library will be used to receive the query response. Also, the security policy is added to run the web site page as HTTPS protocol. Copy the following code as an HTML file:
<html lang="en">
<head>
    <meta http-equiv="Content-Security-Policy" content="upgrade-insecure-requests">
    <meta charset="utf-8"/>
</head>
<body>
    <div id="mapdiv"></div>
    <script src="http://www.openlayers.org/api/OpenLayers.js"></script>
    <script src="http://code.jquery.com/jquery-2.1.1.min.js"></script>
    <script>

        $.getJSON('/api/data', function(data) {
            console.log(data[0].longitude);
            console.log(data[0].latitude);
            var veri1=data[0].longitude;
            var veri2=data[0].latitude;

            map = new OpenLayers.Map("mapdiv");
            map.addLayer(new OpenLayers.Layer.OSM());

            var point;
            var length=data.length;
            //TODO - data haritaya ekleme işlemi
            for (point = 0; point < data.length; point++) {
            var lon=data[point].longitude;
            var lat=data[point].latitude;

            var lonLat = new OpenLayers.LonLat(lon,lat ).transform(new OpenLayers.Projection("EPSG:4326"), // transform from WGS 1984
                                                                map.getProjectionObject() // to Spherical Mercator Projection
                                                                )
            var zoom=15;

            var markers = new OpenLayers.Layer.Markers( "Markers" );
            map.addLayer(markers)

            markers.addMarker(new OpenLayers.Marker(lonLat))

            map.setCenter (lonLat, zoom)
            }
        });
    </script>
  </body>
  </html>
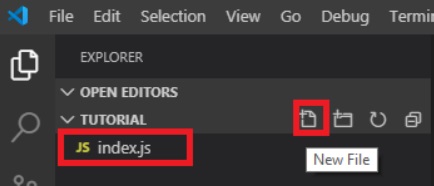
Finally, the website needs to be published through NodeJS. Click the New File and create the index.js file.
This file provides code to publish the website. It reads the HTML page and it sends a response. The content of the file should be:
var express = require('express');
var fs = require('fs');
var DATABASE = require('./database.js');
var app = express();
app.get('/', function (req, res, next) {
res.writeHead(200, { 'Content-Type': 'text/html' });
var myReadStream = fs.createReadStream(__dirname + '/index.html',
'utf8')
myReadStream.pipe(res);
});
app.use('/api/data', function (req, res) {
DATABASE.getAllLocations(function (err, data) {
if (err) {
res.sendStatus(500);
} else {
res.send(data);
}
})
});
app.listen(process.env.PORT || 4000, function(){
console.log("Express server listening on port %d in %s mode",
this.address().port, app.settings.env);
});
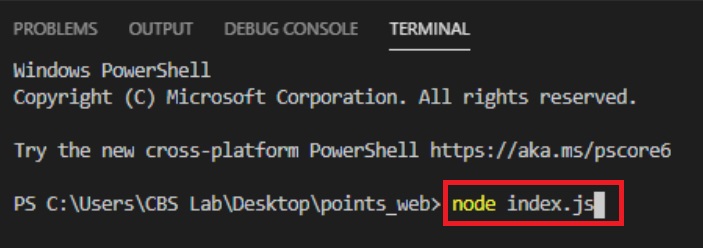
It can be checked whether the website is working or not. Go to terminal and write node index.js, then press enter.
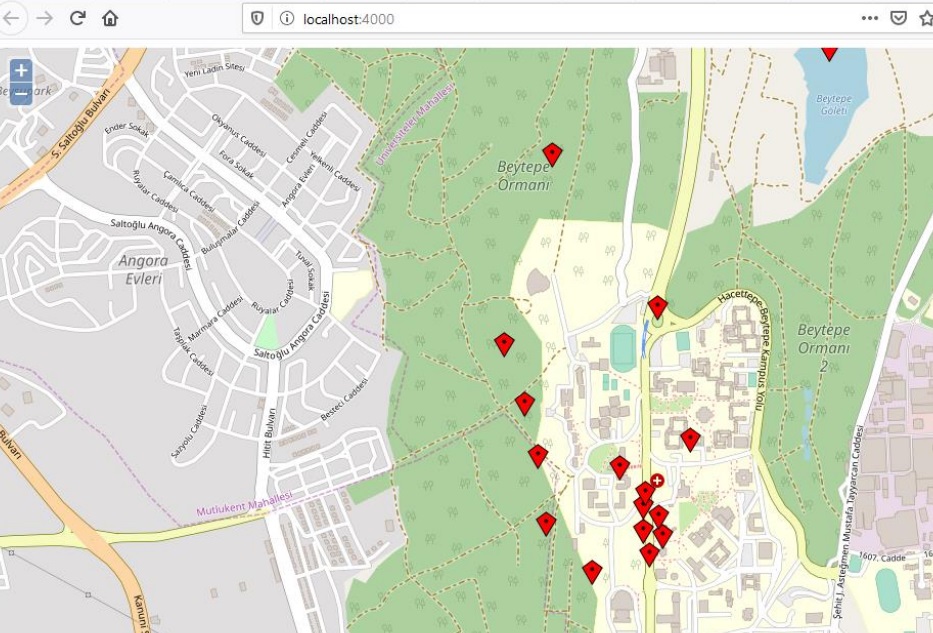
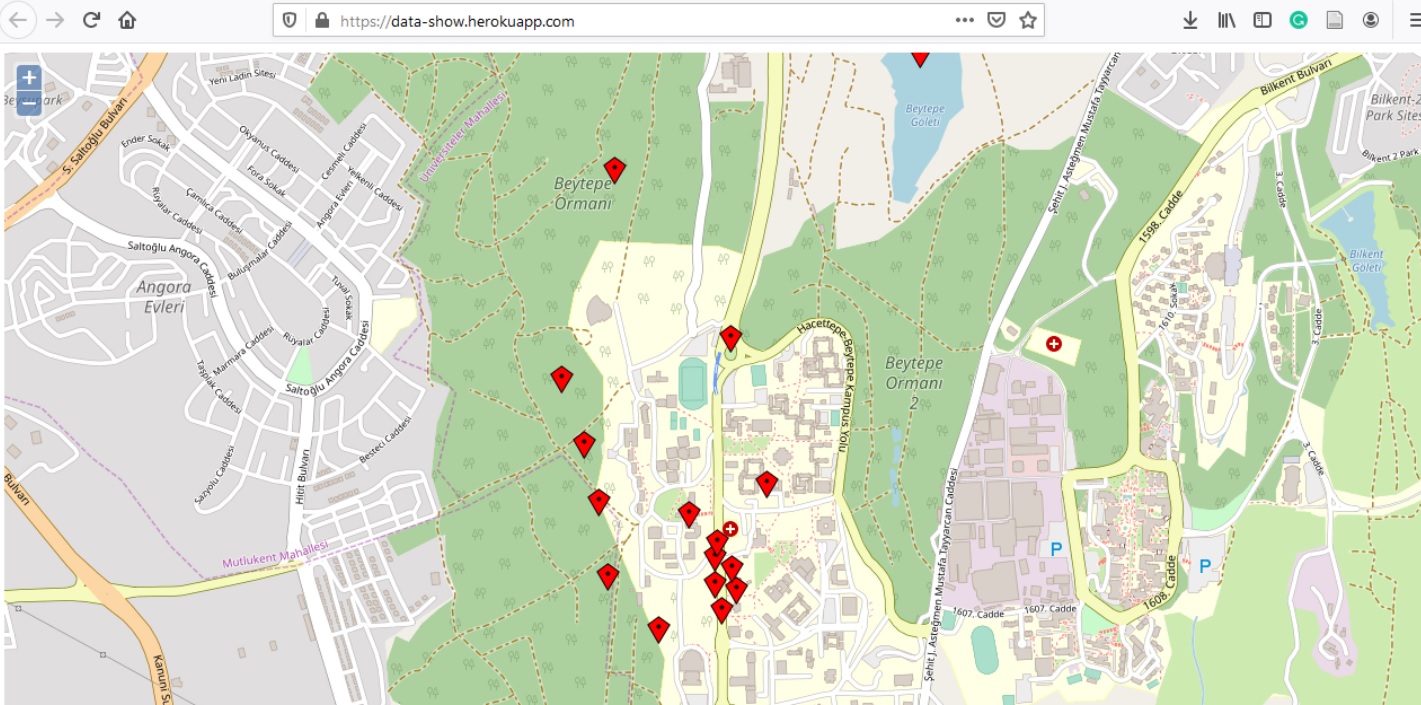
Open a web browser and type: http://localhost:4000/. Once the browser opens, the data stored on the database would be retrieved and displayed on the map as shown below.
Deploying the Project on Heroku
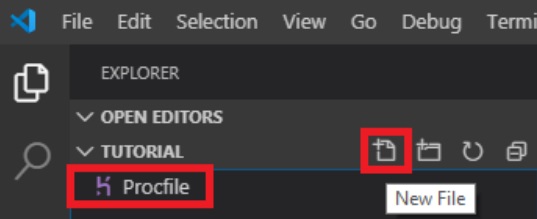
One more file needs to be created before the website is published through Heroku. Go to New File and create Procfile file. Heroku apps include a Procfile that specifies the commands that are executed by the app on startup.
Only the starting file of the project is specified within the Procfile:
web:node index.js
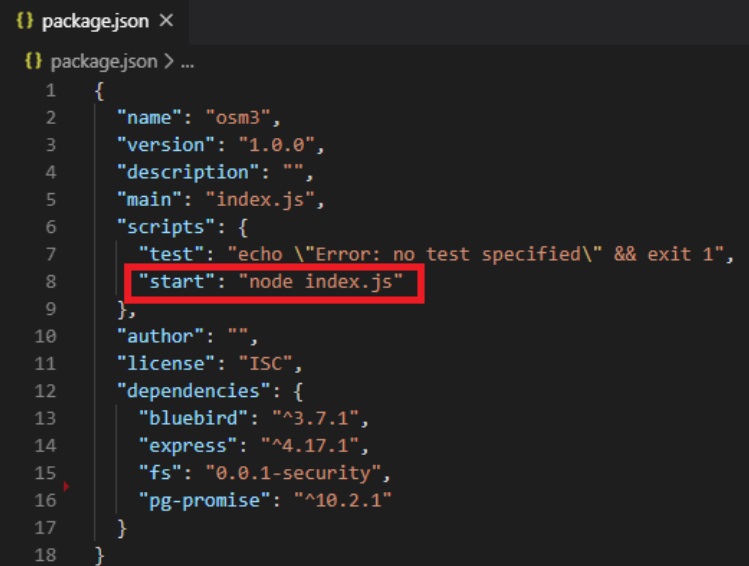
There is one more task to be done before deploying the project on Heroku. The created package.json file needs to be updated. It must be told by which file the website is started. Therefore, the start parameter must be added.
The project is ready to be published on Heroku.
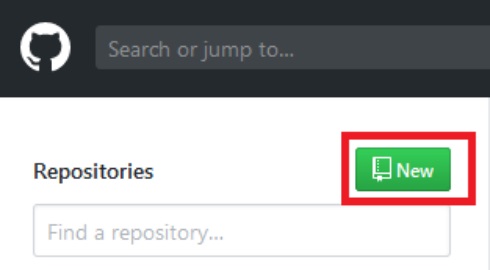
Open an account on Github, and press New.
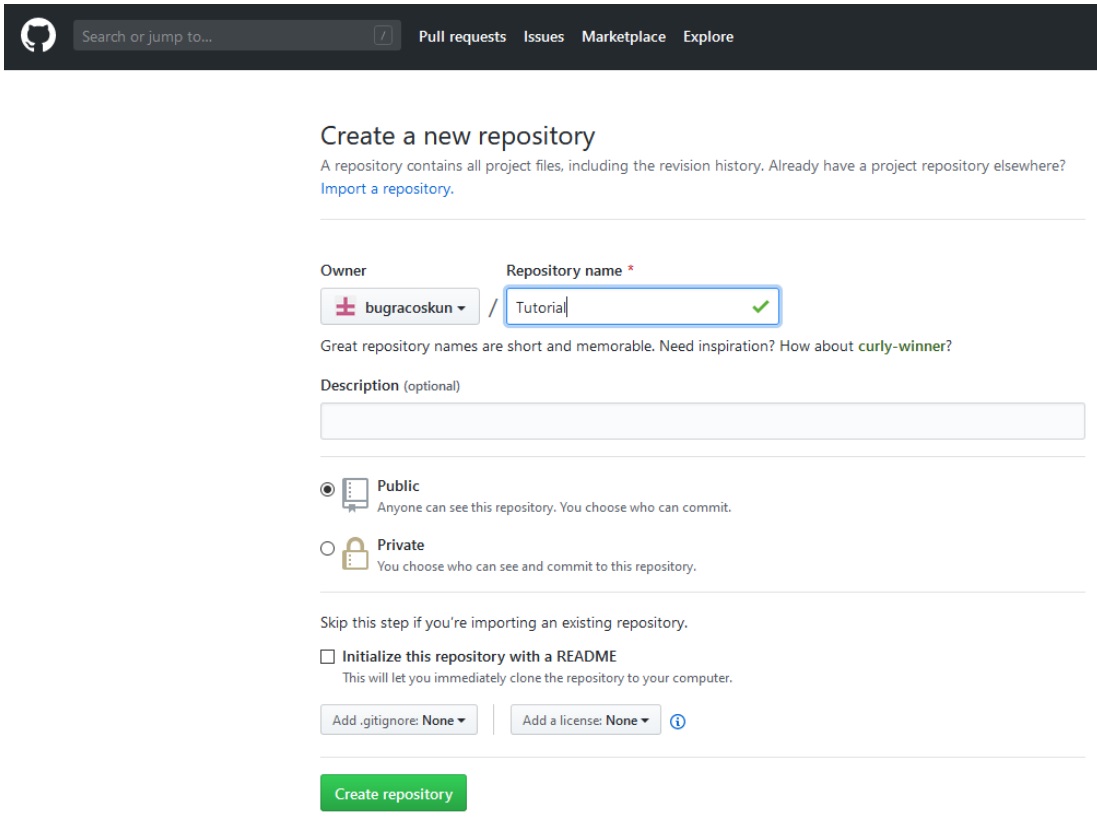
Enter the Repository name and press Create repository.
Go to your project's directory through cmd (Command Prompt). Write the command:
git init
Git is initialized in the folder. Then write this command to add all the contents of the folder:
git add .
Files need to be committed with a command. Write the command:
git commit –m "your message"
After that, establish a remote connection. Note that you need to write the project link instead of ProjectLink. It can be done with:
git remote add origin ProjectLink
The example ProjectLink utilised in this tutorial is: https://github.com/bugracoskun/Tutorial
Now we need to push the project files to GitHub. Write this code:
git push -u origin master
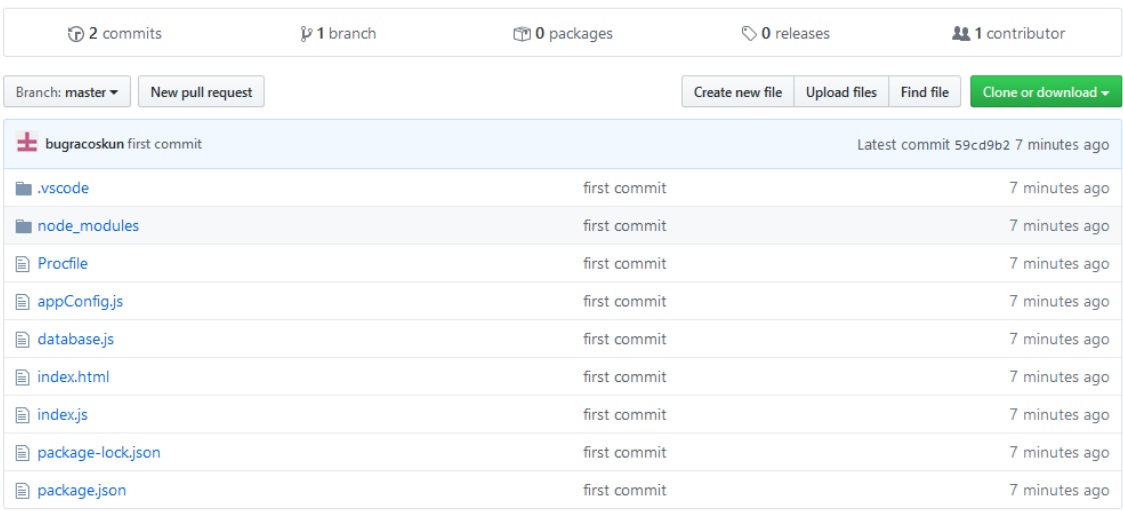
Our files can be seen in the GitHub page.
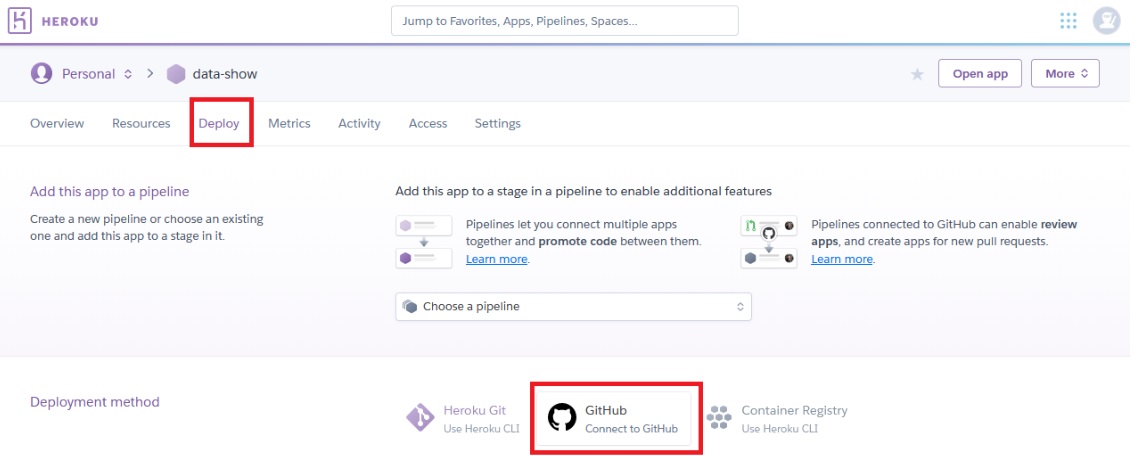
The last step to publish the website is deploying it to Heroku. Go to the Heroku project page. Under Deploy select Github.
Find the repository on Heroku and press Connect.
There are two options: Automatic Deploys and Manual Deploy
Go to Manual Deploy and press Deploy Branch. After the development stage, press View.
The website is published in the given link. Whenever there is an update in QField, it is possible to observe the change on the web page.
Concluding Remarks
Mobile spatial data collection is one of the common tasks that UN officers and patrols carry out on a regular basis. Therefore, easy-to-use and flexible means to achieve this improves the effectiveness of day-to-day operations. Some of the following requirements must be met to facilitate mobile data collection:
- Offline data collection: it might be possible that UN officers might be working on sites where there is limited or no access to internet. Even under such circumstances, the data collection framework must allow offline data collection. Whenever internet becomes available, officers could upload the collected data.
- Attaching multimedia evidence such as photos (and possibly other forms including voice records and videos) to events in order to promote peaceful and inclusive societies for sustainable development. By recording multimedia data on complex scenarios, such as an interview with a victim, it might be possible to have a better understanding on the linkage between undesired ‘events’ and their respective ‘locations’.
- Editing of spatial features on the field. One of the critical requirements to ensure responsive, participatory and representative decision-making at all levels is to have up-to-date data. Therefore, updating currently available databases might be as important as collecting new data.
- Defining user roles is important step towards ensuring quality assurance and quality control (QA/QC); since different users of the same system would usually have different privileges.
- Security of collected, both in terms of server infrastructure as well as providing the means to achieve anonymity, would be important to ensure a smooth data collection process.
This tutorial addressed several of the aforementioned requirements. However, some of them remained unmet. For instance, it was not possible to define user roles due to the limitations of the Heroku platform providing free account. Specifically, it is restricted to execute the SQL command ‘create user’, which would be necessary to define the user privileges. Second, the credentials of the database connection is legible in the QGS file that is transmitted to the mobile devices possessing QField. Even though only confirmed officers would possess this file, it might still be a security breach.
The developments on providing cloud technologies offer the potential to satisfy the aforementioned requirements. The readers of this tutorial are encouraged to follow the developments on QField Cloud. Integrating such developments into the current tutorial would substantially improve the data collection and update operations in the field.
