Difference between revisions of "Resultados del Tutorial ISSTOCAM WebGIS"
(Tutorial Screenshots) |
m (removing vandalism) |
||
| (29 intermediate revisions by 10 users not shown) | |||
| Line 1: | Line 1: | ||
| − | This page shows some screenshots of the results of a 6 day WebGIS workshop at the IODE Project Office (UNESCO/IOC) in Oostende, Belgium. Paticipants came from Ecuador, Colombia, Peru, Chile, online resources from Brazil and a special guest from Belgium. | + | This page shows some screenshots of the results of a 6 day WebGIS workshop at the IODE Project Office (UNESCO/IOC) in Oostende, Belgium. Paticipants came from Ecuador, Colombia, Peru, Chile, online resources from Brazil and a special guest from Belgium. During the course the page [[Sudamerica]] was created and some of the participants left their traces in this Wiki. Contact them or hack the correpsonding page if you are interested to further this local chapter, workgroup, page of interrest or whatever it will turn out to be. |
| + | |||
| + | == Used Software == | ||
| + | During the course a lot of software has been installed some of which is explicitlz mentioned here including the reason why it was included. | ||
| + | |||
| + | == Installation Instructions == | ||
| + | If you want to try out the OSGeo SDI Stack read the [[Instrucciones de Instalación Course WebGIS Español]]. | ||
| + | |||
| + | === FOSS Geospatial Software === | ||
| + | * [[MapServer]] | ||
| + | * [[GDAL/OGR]] | ||
| + | * [[GeoServer]] | ||
| + | * [[PostGIS]] | ||
| + | * [[Mapbender]] | ||
| + | * [[QuantumGIS]] | ||
| + | |||
| + | === System Software === | ||
| + | * Apache http Server | ||
| + | * PostgreSQL | ||
| + | |||
| + | == Used Data Sets == | ||
| + | The attendees of the course brought a broad set of data including arid zones of south america, water quality stations, topographic maps, rivers as linestrings, etc. | ||
| + | |||
| + | * '''Colombia''' [http://www.dimar.mil.co Direccion General Maritima DIMAR]; [http://www.invemar.org.co Instituto de Investigaciones Marinas y Costeras INVEMAR] | ||
| + | * '''Chile''' [http://shoa.cl Servicio Hidrografico y Oceanografico de la Armada]; [http://www.cazalac.org CAZALAC] | ||
| + | * '''Brazil''' (servicio WMS demo de la [http://www.univali.br/ Universidade do Vale do Itajai] | ||
| + | * '''Belgium''' Continental Shelf [http://www.vliz.be VLIZ] as special guest | ||
| + | * '''Perú''' [http://www.dhn.mil.pe Direccion de Hidrografía y Navegación DHN] | ||
| + | |||
| + | == Screenshot of Bathimetric data off the Brazilian Coast == | ||
| + | This screenshot shows several WMS services, one with bathymetric data off the Brazilian coast. Check [[Sudamerica]] for the corresponding WMS GetCapabilities URL. | ||
| + | |||
| + | [[Image:Brazil batimetria.png]] | ||
| + | |||
| + | == Screenshot of Arid Zones in Sudamerica == | ||
| + | The data comes as shape files and has been added to a MapServer as WMS and WFS. For usability reasons later WFS was also added using GeoServer. | ||
| + | |||
| + | [[Image:Latin american carribbean.jpg|thumb|center|700px|Zonas Aridas en America del Sud]] | ||
| + | |||
| + | == Screenshot of Microbiological quality of the water of Colombia == | ||
| + | The data comes as shape files and has been added to a MapServer as WMS and WFS. For usability reasons later WFS was also added using GeoServer. | ||
| + | |||
| + | [[Image:MICROBIOLOGIC_WATER_QUALITY_COLOMBIA.JPG|thumb|center|700px|Microbiotic Water Quality in Colombia]] | ||
| + | |||
| + | == Pantalla de las Zonas Aridas de Colombia == | ||
| + | Los datos son capturados desde una base de datos en postgreSQL con la ayuda de Mapserver como WMS y WFS. | ||
| + | |||
| + | [[Image:ColombiaZA.jpg]] | ||
| + | |||
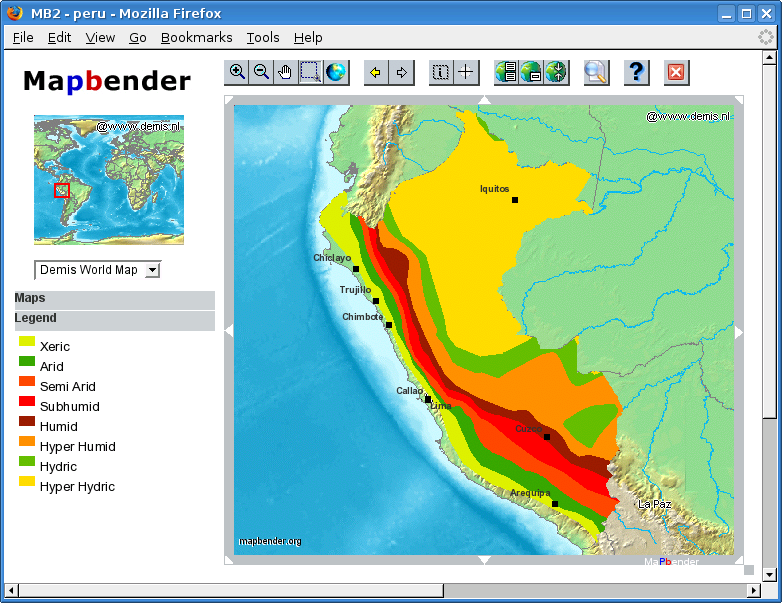
| + | == Pantalla de las Zonas Aridas del Peru == | ||
| + | Los datos son capturados desde una base de datos en PostgreSQL / PostGIS con la ayuda de MapServer como WMS y WFS. | ||
| + | |||
| + | [[Image:Zonas aridas del peru.png]] | ||
| + | |||
| + | === Notas de clase === | ||
| + | * Instalación de Mapbender | ||
| + | |||
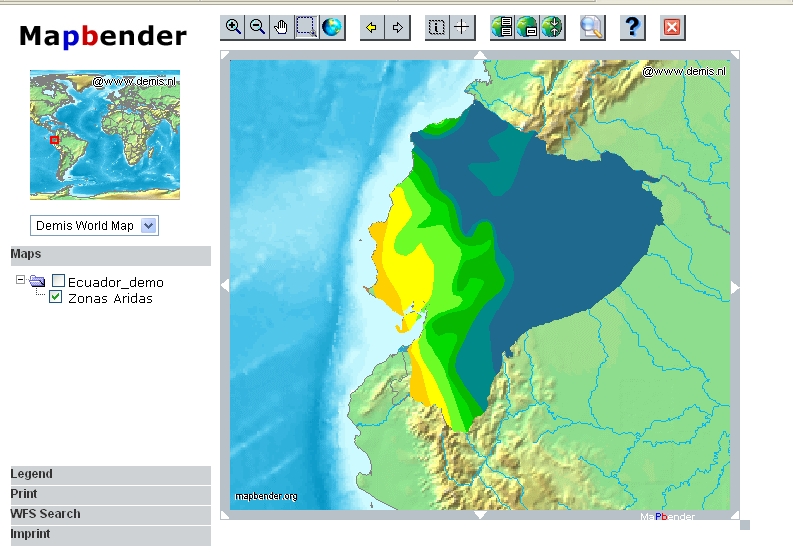
| + | == Pantalla de las Zonas Aridas del Ecuador == | ||
| + | Los datos son capturados desde una base de datos en PostgreSQL / PostGIS con la ayuda de MapServer como WMS y WFS. | ||
| + | |||
| + | [[Image:Ecuador.JPG]] | ||
| + | |||
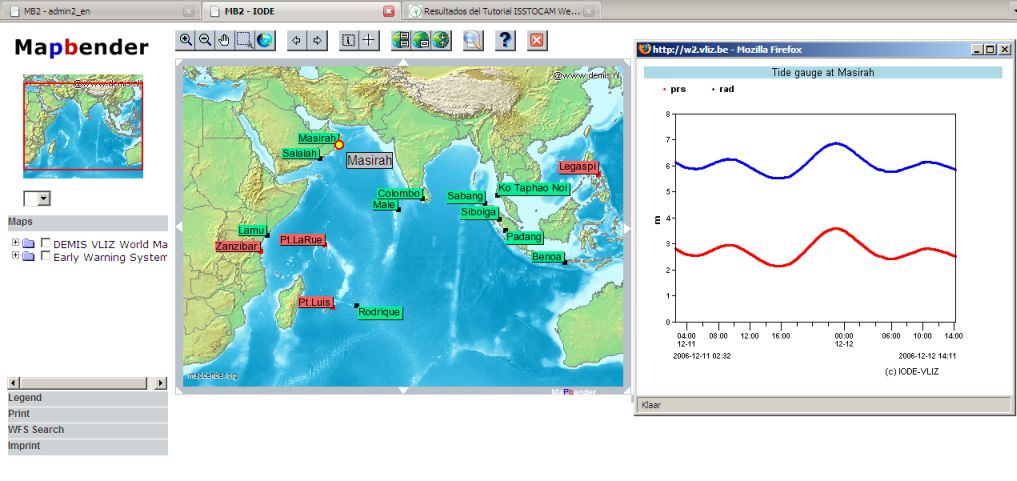
| + | == Tsunami Warning System in the Indian Ocean == | ||
| + | An overview of the Tsunami Warning System in the Indian Ocean using WMS and WFS. Data is stored in a MSSQL database and rendered by MapServer using an OVF map-file (this simulates a geometry coming from two lat and lon coordinate column). The information window pops up using the usemap module in MapBender. | ||
| + | |||
| + | [[Image:Indianocean.JPG]] | ||
Latest revision as of 00:25, 11 April 2011
This page shows some screenshots of the results of a 6 day WebGIS workshop at the IODE Project Office (UNESCO/IOC) in Oostende, Belgium. Paticipants came from Ecuador, Colombia, Peru, Chile, online resources from Brazil and a special guest from Belgium. During the course the page Sudamerica was created and some of the participants left their traces in this Wiki. Contact them or hack the correpsonding page if you are interested to further this local chapter, workgroup, page of interrest or whatever it will turn out to be.
Used Software
During the course a lot of software has been installed some of which is explicitlz mentioned here including the reason why it was included.
Installation Instructions
If you want to try out the OSGeo SDI Stack read the Instrucciones de Instalación Course WebGIS Español.
FOSS Geospatial Software
System Software
- Apache http Server
- PostgreSQL
Used Data Sets
The attendees of the course brought a broad set of data including arid zones of south america, water quality stations, topographic maps, rivers as linestrings, etc.
- Colombia Direccion General Maritima DIMAR; Instituto de Investigaciones Marinas y Costeras INVEMAR
- Chile Servicio Hidrografico y Oceanografico de la Armada; CAZALAC
- Brazil (servicio WMS demo de la Universidade do Vale do Itajai
- Belgium Continental Shelf VLIZ as special guest
- Perú Direccion de Hidrografía y Navegación DHN
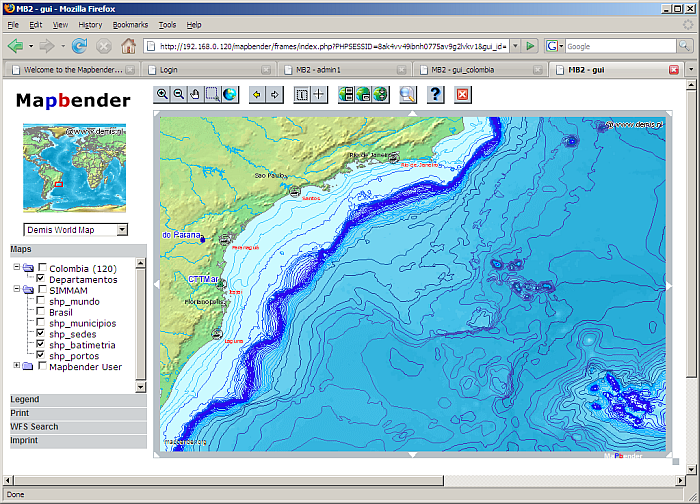
Screenshot of Bathimetric data off the Brazilian Coast
This screenshot shows several WMS services, one with bathymetric data off the Brazilian coast. Check Sudamerica for the corresponding WMS GetCapabilities URL.
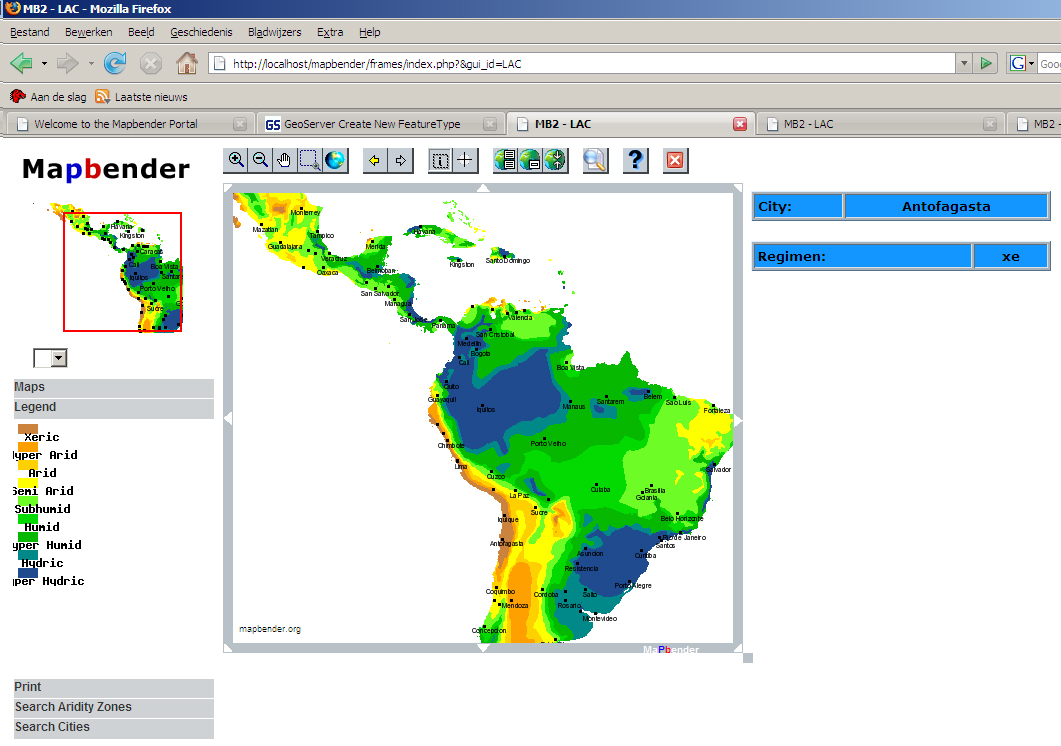
Screenshot of Arid Zones in Sudamerica
The data comes as shape files and has been added to a MapServer as WMS and WFS. For usability reasons later WFS was also added using GeoServer.
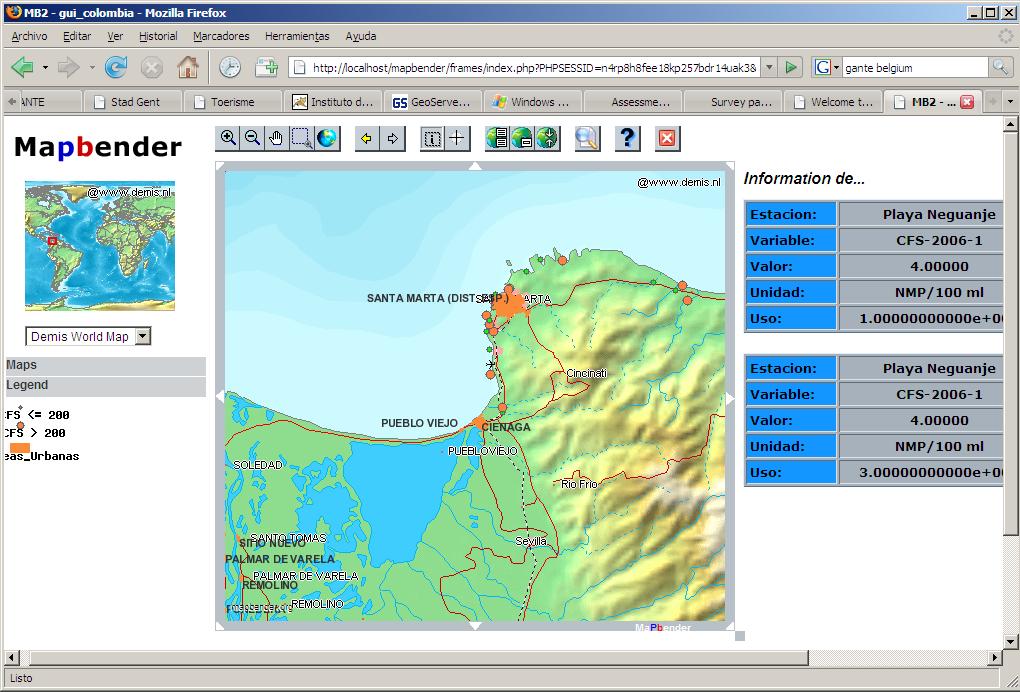
Screenshot of Microbiological quality of the water of Colombia
The data comes as shape files and has been added to a MapServer as WMS and WFS. For usability reasons later WFS was also added using GeoServer.
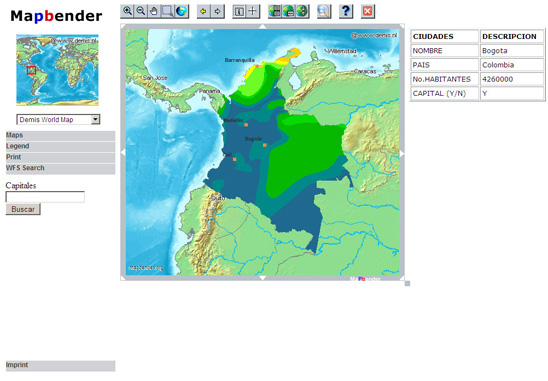
Pantalla de las Zonas Aridas de Colombia
Los datos son capturados desde una base de datos en postgreSQL con la ayuda de Mapserver como WMS y WFS.
Pantalla de las Zonas Aridas del Peru
Los datos son capturados desde una base de datos en PostgreSQL / PostGIS con la ayuda de MapServer como WMS y WFS.
Notas de clase
- Instalación de Mapbender
Pantalla de las Zonas Aridas del Ecuador
Los datos son capturados desde una base de datos en PostgreSQL / PostGIS con la ayuda de MapServer como WMS y WFS.
Tsunami Warning System in the Indian Ocean
An overview of the Tsunami Warning System in the Indian Ocean using WMS and WFS. Data is stored in a MSSQL database and rendered by MapServer using an OVF map-file (this simulates a geometry coming from two lat and lon coordinate column). The information window pops up using the usemap module in MapBender.
