Difference between revisions of "AJAX WebMapping Vector Rendering Design"
Wiki-Woodbri (talk | contribs) |
|||
| Line 58: | Line 58: | ||
# A group of cyclists documents their summer trip in a data set with a long polyline covering four thousand miles miles and various point features with interesting styling and labels. TC wants to *play* the story in an OpenLayers map. By "play," I mean the video analogy of having a stop/play forward/play backward button, fast forward and fast backward buttons, and when the system is in action, the map automatically moves and the popups automatically appear as the map moves along the route at some scale specified in the styling made by the cyclists. What data structures represent the cyclists' details? What sequence of methods cause the movie to play? | # A group of cyclists documents their summer trip in a data set with a long polyline covering four thousand miles miles and various point features with interesting styling and labels. TC wants to *play* the story in an OpenLayers map. By "play," I mean the video analogy of having a stop/play forward/play backward button, fast forward and fast backward buttons, and when the system is in action, the map automatically moves and the popups automatically appear as the map moves along the route at some scale specified in the styling made by the cyclists. What data structures represent the cyclists' details? What sequence of methods cause the movie to play? | ||
# TC gets assigned a task: digitize all the roads in Madagascar using this 60cm satellite imagery. How does this design make that easy? I realize that some of these may get cast out of initial designs as being too advanced for our first pass. However, I think such a choice should be made consciously. | # TC gets assigned a task: digitize all the roads in Madagascar using this 60cm satellite imagery. How does this design make that easy? I realize that some of these may get cast out of initial designs as being too advanced for our first pass. However, I think such a choice should be made consciously. | ||
| + | |||
| + | Some additional use cases added by Stephen Woodbridge: | ||
| + | |||
| + | #TC has loaded some polygon data from different sources. He has some some adjacent polygons that he want to share a common edge. He needs to select each polygon and the start and end of the shared edge on each that needs to be snapped together. The first polygon can be the control and the second one gets manipulated. The edge of the second between the start and end gets removed and replaced by points from the first between its start and end marks. | ||
| + | #TC does not like some of the points on the shared edge, he would like to select the two polygons and move some of the points along the shared edge and some that are not shared. After looking at his handiwork and TC would like to undo the last few moves. | ||
| + | #TC thinks it is a bother to keep selecting both polygons to do the manipulation and would prefer to "link them together" along the common edge. | ||
| + | #To some extent this imply using topology, and planning for topology support could be very powerful, but this can also be done by maintaining some additional pointers and tracking and updating their children and avoiding circular references. | ||
Revision as of 06:36, 18 October 2006
This design aims to be a summary of ideas from Mapbuilder, OpenLayers, and webmap-dev communities regarding vector rendering design. This is not supposed to be the final design, but rather draft to be used to facilitate further discussions. My hope is that the final version of this design will be used by all the AJAX webmapping clients to make sharing the same code base easier. I'd like to credit Patrice Cappelaere who has SVG/VML rendering working in Mapbuilder and deployed at GeoBliki. This design aims to extend Patrice's code to be more generic and extensible.
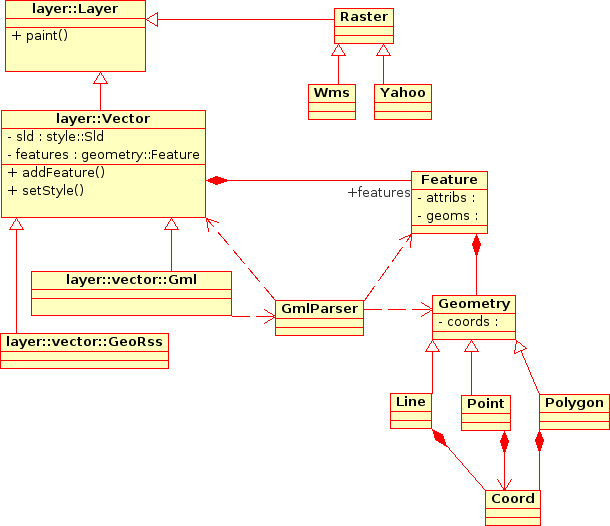
Vector Layers Class Diagram
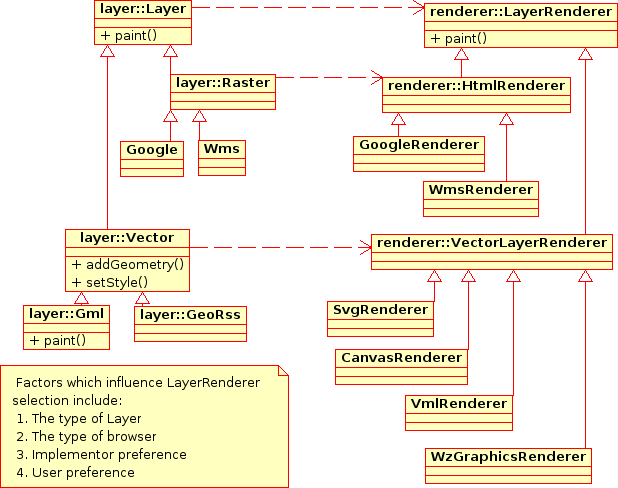
Layer/Renderer Class Diagram
The key here is that the DataSource (or Layer) is being kept seperate to the Rendering mechanism. This is a graduation away from existing OpenLayers code which previously merged the DataSource and Rendering in the same Object.
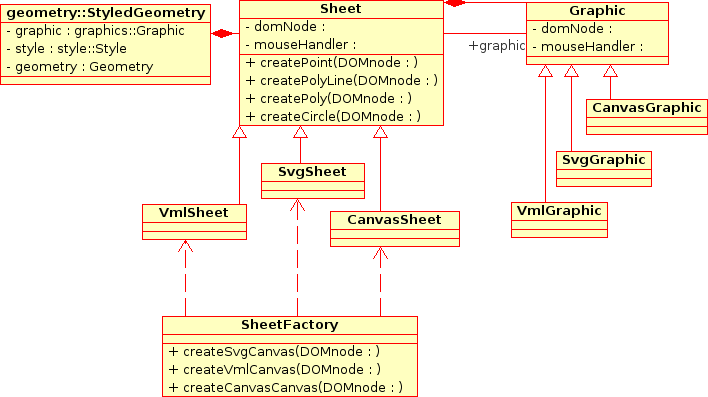
Graphics Class Diagram
There are opportunities for collaboration with other projects/libraries in this Graphics package. In particular:
- This Graphics library should be able to stand alone as a graphics rendering library, independant of the Geospatial side of the code. It can then be packaged up and used for other AJAX clients requiring Vector rendering graphics.
- ExplorerCanvas is a cross browser Canvas library. This could be extended to support SVG, WZGraphics, Flash etc.
- http://starkravingfinkle.org/blog/2006/03/svg-in-ie is worth watching too.
Comments
- Cameron Shorter / Paul Spensor: We should have a GraphicsRenderer class which has children: SvgGraphicsRenderer, VmlGraphicsRenderer, etc. We would then have a GraphicsFactory which creates the different GraphicsRenderer classes.
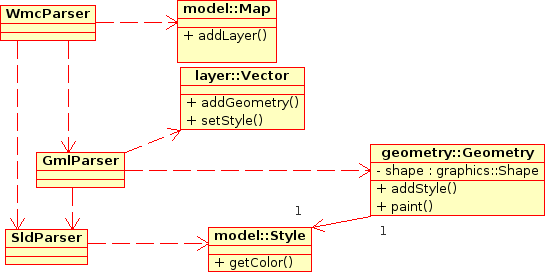
Parsers Class Diagram
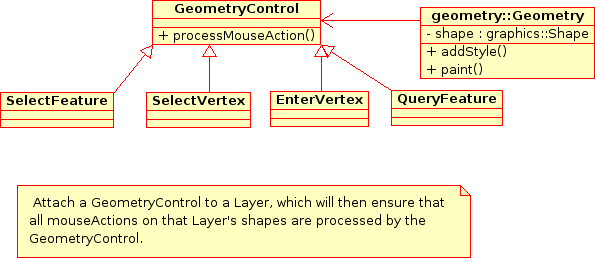
MouseEvent Processing Class Diagram
MouseEvents can be attached to each SVG/VML shape. This means that we can add functions like:
- Popups when a user hovers over a feature.
- Select a feature when a user clicks on the feature.
- Select a vertex when a user clicks on a vertex. (This would require a shape to be drawn on each vertex of a line being queried).
Initialisation Sequence Diagram
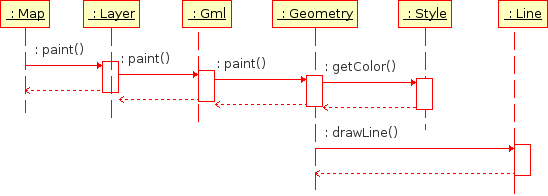
Paint Sequence Diagram
Source UML
The source UML diagram is stored in the Mapbuilder subversion repository at: https://svn.codehaus.org/mapbuilder/trunk/mapbuilder/mapbuilder/design/uml/graphics.xmi It was created using Umbrello on Linux.
Use Cases
John Frank did an excellent job outlining the major use cases for Geospatial Vector Rendering:
Better vector data support in OpenLayers will help many of us. I am totally in favor of it. To reality check the proposed design, I'd like to see a few use cases sketched out. Here are a few that seem important to me. Each use case has two components: a user interface challenge and a datastructure challenge. There will typically be many solutions to the user interface challenge; I'm suggesting we think of at least one UI solution to check the proposed nouns and verbs. The canonical "user" is always a very Tough Customer, so I use that as though it were a person's name, and their initials are TC
- An open polyline and also a point are rendered on the screen. TC wants to *add* the point to the polyline to increase its depiction of some underlying reality. How does TC specify where in the line to add the point, and how do these classes handle that insertion? Logically, the input needs to specify which existing segment of the polyline to break and replace with two new line segments.
- Continuing one: TC wants to move an existing point in a polyline...
- TC constructs a sequence of points by clicking in the map, and wants to see those points connected together in a polyline. Naturally, TC will construct a self-intersecting path. What is the sequence of method calls?
- After loading several vector data layers from various sources, TC wants to merge ten different features together into one "thing" that can be stored separately. How does she do that? What happens in the code? How does it keep track of where the data came from originally?
- After loading a vector data layer that may or may not have come with styling information, TC wants to change the styling information used in presenting that data on her map. Using some eye candy on the screen, she can input some choices, and then: what are the sequence of actions under the hood?
- Continuing four: TC wants to change the *displayed position* of a point or a line without changing the underlying data. As cartography, each map's visual appearance communicates information that a particular scale might not permit the raw data to easily reveal. The canonical example was shown at the ESRI UC a few weeks ago: two road segments are distinct, but at a particular scale, the cartographic styling makes them appear so wide that they merge visually. The best known solution to this is to actually move one of the line's pixel position to visually indicate the merger. What is the sequence of steps and what datastructures change? How are the styling choices associated with the chosen scale?
- After laying out a sequence of points that form a closed polygon, TC wants to know the area and perimeter of the polygon. How does this information get calculated and passed out?
- A group of cyclists documents their summer trip in a data set with a long polyline covering four thousand miles miles and various point features with interesting styling and labels. TC wants to *play* the story in an OpenLayers map. By "play," I mean the video analogy of having a stop/play forward/play backward button, fast forward and fast backward buttons, and when the system is in action, the map automatically moves and the popups automatically appear as the map moves along the route at some scale specified in the styling made by the cyclists. What data structures represent the cyclists' details? What sequence of methods cause the movie to play?
- TC gets assigned a task: digitize all the roads in Madagascar using this 60cm satellite imagery. How does this design make that easy? I realize that some of these may get cast out of initial designs as being too advanced for our first pass. However, I think such a choice should be made consciously.
Some additional use cases added by Stephen Woodbridge:
- TC has loaded some polygon data from different sources. He has some some adjacent polygons that he want to share a common edge. He needs to select each polygon and the start and end of the shared edge on each that needs to be snapped together. The first polygon can be the control and the second one gets manipulated. The edge of the second between the start and end gets removed and replaced by points from the first between its start and end marks.
- TC does not like some of the points on the shared edge, he would like to select the two polygons and move some of the points along the shared edge and some that are not shared. After looking at his handiwork and TC would like to undo the last few moves.
- TC thinks it is a bother to keep selecting both polygons to do the manipulation and would prefer to "link them together" along the common edge.
- To some extent this imply using topology, and planning for topology support could be very powerful, but this can also be done by maintaining some additional pointers and tracking and updating their children and avoiding circular references.
